Figure 3.
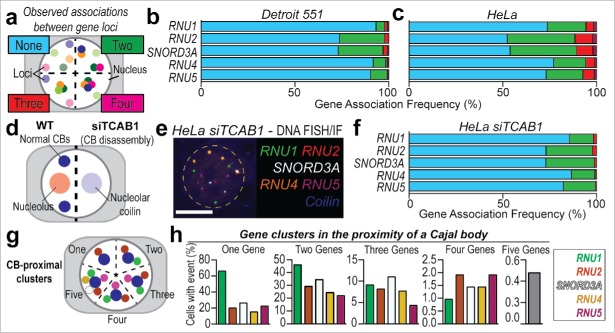
Higher-order gene pairing analysis using SpectraFISH in diploid and aneuploid cells. (A) Quantitation strategy for colocalized genes, (B) Gene co-localization frequency (%, normalized to total number of alleles scored) for non-clustered alleles (“None,” blue), pairs of U snRNA and snoRNA genes (“Two,” green) and higher-order complexes (“Three,” red; “Four,” magenta) in Detroit 551 cells, and, (C) HeLa cells, (D) Schematic depicting effect of TCAB1 depletion by siRNA (siTCAB1, 60 h) upon CB integrity and coilin distribution in HeLa cells, (E) SpectraFISH microscopy single pseudochannel images in HeLa nuclei following TCAB1 siRNA treatment, (F) Gene co-localization frequency (%) for pairs of U snRNA and snoRNA genes in HeLa cells following TCAB siRNA treatment, (G) Quantitation strategy for CB-proximal gene clustering in HeLa cells, (H) Frequency (%) of 2, 3, 4 or 5 genes clustering proximal to a CB, normalized to total cell number. N = 2 biological replicates, Average number of alleles scored per cell: HeLa – RNU1: 3.02, RNU2: 2.94, SNORD3A: 3.09, RNU4: 3.89, RNU5: 3.08; Detroit 551 fibroblasts – Only cells containing 2 alleles of each gene were scored. White scale bar = 5 µm, nucleus false annotated by yellow dashed oval.

