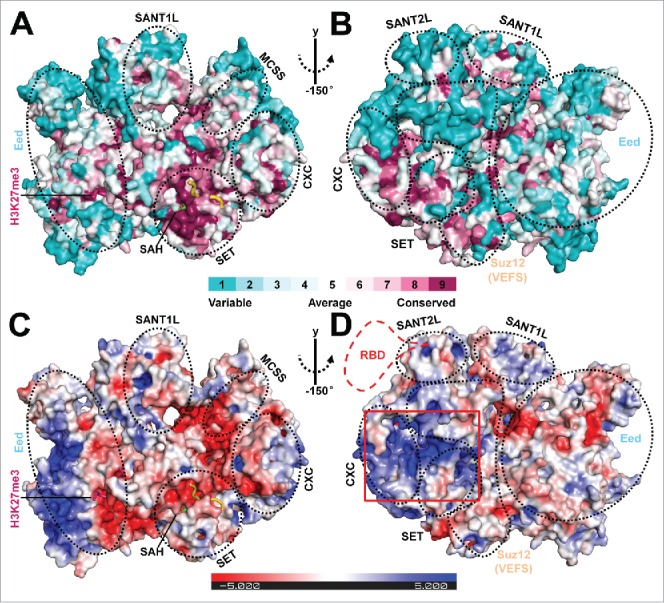
Figure 2.

Structural analysis of the surface features of PRC2. (A and B) Front and back views of the structural conservation of the active fungal PRC2 in comparison to its human counterpart in surface representation. Surfaces are colored by ConSurf (http://consurf.tau.ac.il/).28 A complete structural model of PRC2 was obtained by adding the missing residues using Modeler 29 based on the PRC2 structure in the stimulated state. The new model was then used for conservation analysis. The scale bar indicates the conservation level of the residues on the surface. The individual domains in the complex are indicated by dotted black circles. The same model was used to generate Fig. 2C and 2D. (C and D) Front and back views of the electrostatic surface of the fungal PRC2 generated by Pymol using APBS calculation and colored by potential on solvent accessible surface.30 The scale bar (±5 kT/e) indicates the electrostatic potential on the surface. The predicted conserved RNA binding surface is highlighted by a red rectangular box. A putative human-specific RNA binding domain (RBD) is also illustrated by a dotted red line in Fig. 2D.
