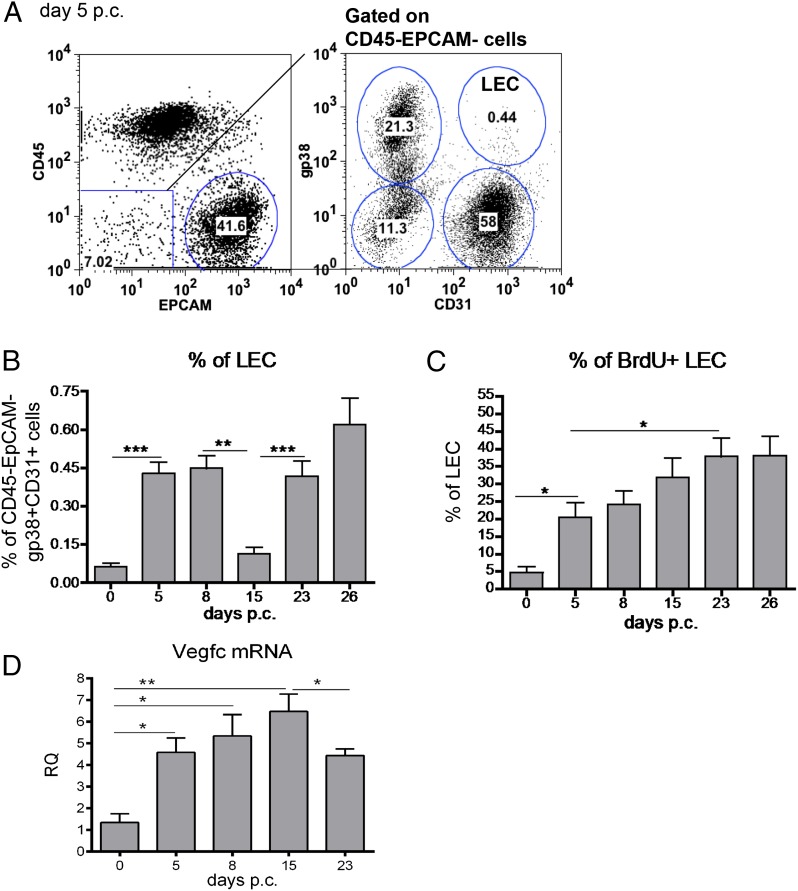
FIGURE 1.
Bimodal expansion of the lymphatic bed during TLS development. (A) Representative dot plots showing flow cytometry staining for gp38 and CD31 in the CD45−EpCAM− cells from salivary glands isolated at day 5 after viral cannulation. The LECs are identified as gp38+CD31+ cells. (B) Time course of LEC expansion during the inflammatory process determined by flow cytometry (percentage of gp38+CD31+ population in the CD45−EpCAM− component) from infected wt mice at days 0, 5, 8, 15, 23, and 26 p.c. Data are presented as means of five independent experiments. **p < 0.01, ***p < 0.001, unpaired t test, comparing LEC population at each time point with day 0 p.c. LEC. (C) Graphs showing summary of analysis for percentage of proliferating (BrdU+) gp38+CD31+ LECs in the CD45−EpCAM− stromal fraction. BrdU was administered from day 0 continuously. *p < 0.05, **p < 0.01 versus day 0 p.c. for wt mice. (D) Quantitative RT-PCR analysis of mRNA transcript for Vegfc in wt mice at days 0, 5, 8, 15, and 23 p.c. Transcripts were normalized to housekeeping gene β-actin. The RQ expression values were calibrated with day 0 p.c. salivary gland values. Data are representative of three to four independent experiments with six to eight glands analyzed per group. Data are shown as mean ± SEM. *p < 0.05, **p < 0.01.

