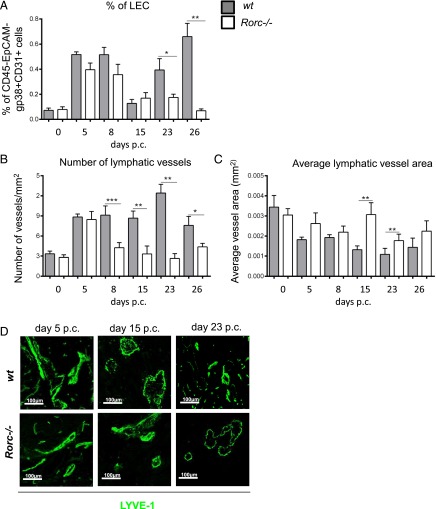
FIGURE 7.
Lymphatic vessel formation is influenced by the expression of LTβ by Rorγ+ cells. (A) Graph showing flow cytometry analysis of LEC expansion in wt mice (filled bars) compared with Rorc−/− mice (open bars). Data are represented as mean ± SEM of two independent experiments. *p < 0.05, **p < 0.01, unpaired t test, comparing gp38+CD31+ LEC population in infected knockout mice at various time points to their wt counterparts. (B) Graphs showing the number of lymphatic vessels/mm2 of tissue in wt mice (filled bars) compared with Rorc−/− (open bars) mice. Data are representative of mean ± SEM of three independent experiments with four to six glands analyzed per group. *p < 0.05, **p < 0.01, ***p < 0.001, unpaired t test, comparing LYVE-1+ vessels in infected knockout mice at various time points to their wt counterparts. (C) Graphs showing average vessel area (mm2) in wt mice (filled bars) compared with Rorc−/− mice (open bars). Data are representative of mean ± SEM of three independent experiments with four to six glands analyzed per group. *p < 0.05, **p < 0.01, ***p < 0.001, unpaired t test, comparing LYVE-1+ vessels in infected knockout mice at various time points to their wt counterparts. (D) Representative photomicrograph of lymphatic vessels in infected salivary glands (days 5, 15, and day 23 p.c.) from Rorc−/− mice in comparison with wt mice stained for LYVE-1 (green). Scale bars, 100 μm.

