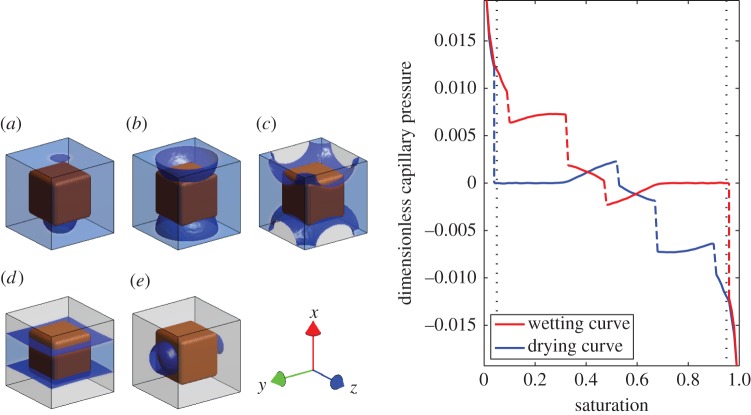
Figure 4.
Interface position for decreasing saturation and the corresponding water release curve. The geometry shown is periodic in the x, y and z directions with a soil particle in the centre of the cell: (a) 95% saturation, (b) 75% saturation, (c) 55% saturation, (d) 35 % saturation and (e) 5 % saturation. The black dotted lines on the water release curve (right-hand side image) show 5% and 95% saturation, respectively. These correspond to the point at which the bubble solution is valid; this point is discussed further in the main text. (Online version in colour.)

