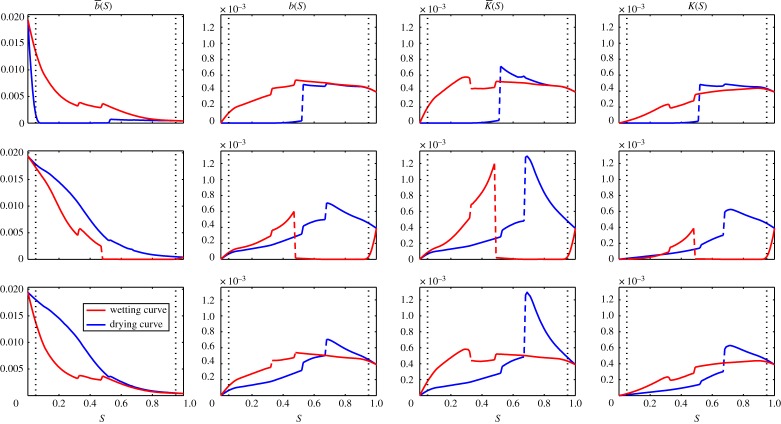
Figure 5.
Effective diffusivity as a function of saturation for wetting and drying curves. Note the function uses a different scale to b(S), K(S) and . The functions are calculated by solving equations (2.22) and (2.23) for 0.05<S<0.95 in steps of 0.01 and for S=0 and S=1. The values for 0<S<0.95 and 0.95<S<1 are calculated through interpolation. The black dotted lines show S=0.05 and S=0.95. (Online version in colour.)

