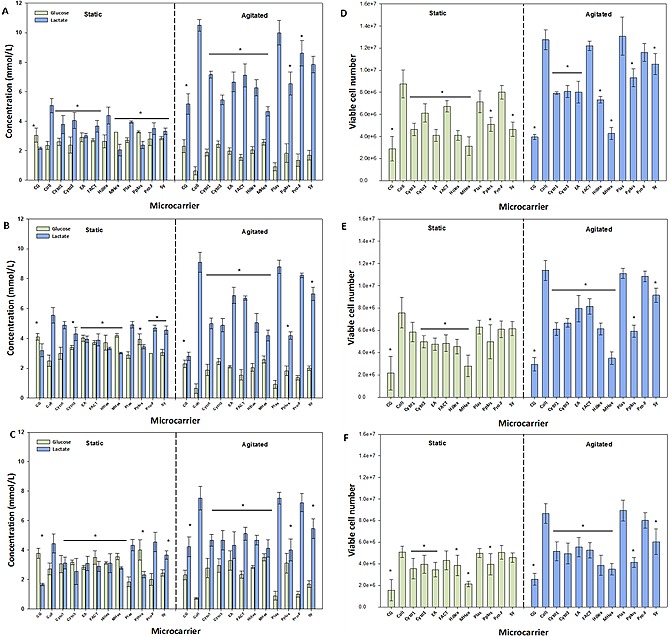
Figure 3.

Comparison of static and agitated conditions for hBM‐MSC microcarrier culture, and a comparison of different microcarriers in 100 mL spinner flasks. Glucose consumption and lactate production for hBM‐MSC1 (A), hBM‐MSC2 (B) and hBM‐MSC3 (C). Viable cell number for hBM‐MSC1 (D), hBM‐MSC2 (E) and hBM‐MSC3 (F). Data is presented as mean ± standard deviation (SD) (n = 4). Significant differences in values were noted with p < 0.05 (*) in comparison to the highest respective value.
