
Figure 1.
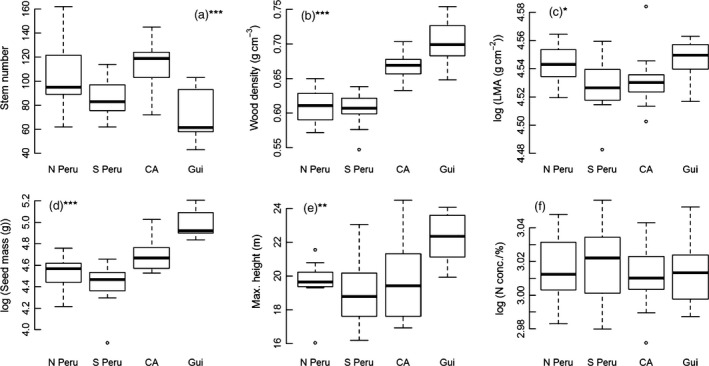
Box plots of variation in (a) stem density and mean values of (b) wood density, (c) leaf mass per unit area, (d) seed mass, (e) maximum height and (f) mean nitrogen concentration for stems 2–10 cm diameter in forests in four regions of Amazonia (north and south Peru, Central Amazonia (Manaus; CA) and the Guiana Shield (Nouragues; Gui). Significant differences among sites shown as P < 0.05 (*), P < 0.01 (**), P < 0.001 (***).