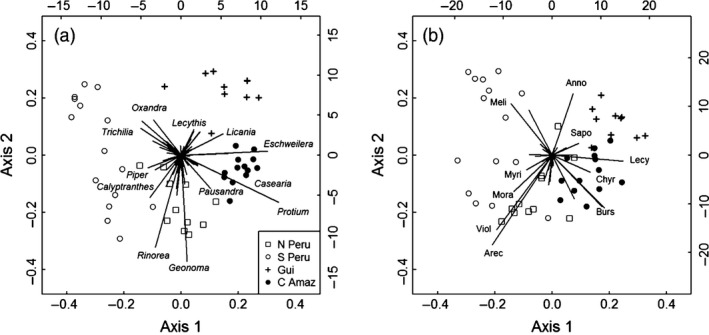
Figure 2.

Principal coordinates analysis using Bray Curtis dissimilarity measure of the variation in (a) genus‐level and (b) family‐level composition of stems 2–10 cm diameter in undisturbed, control 20 × 20 m subplots of four Amazonian forests (north and south Peru, Central Amazonia (Manaus; CA) and the Guiana Shield (Nouragues; Gui). In each graph, the points represent sites, and the lines represent the ordination of genera and families. Key genera and families are labelled on each graph.
