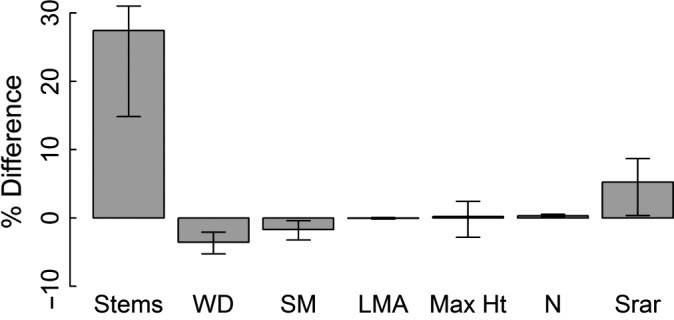
Figure 3.

Mean and 95% confidence limits on percentage change in stem density, mean community‐level traits (WD – wood density, SM – Seed mass, LMA – leaf mass per unit area, Max Ht – maximum height and N – nitrogen concentration) and diversity (based on rarefied species richness) between disturbed and control subplots in four Amazonian forests.
