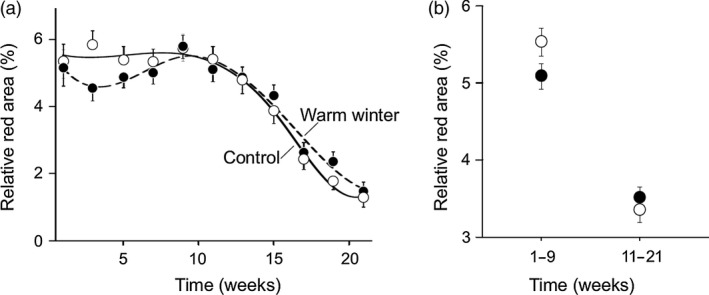
Figure 2.

Temporal change in relative red area with respect to the winter temperature treatment. (a) Changes in mean ± SE relative red area over the reproductive season from 26 March 2014 to 21 August 2014. For illustrative purpose, adjusted splines are also presented. (b) The average values before and after the onset of senescence (1st–9th week and 11th–21st week, respectively).
