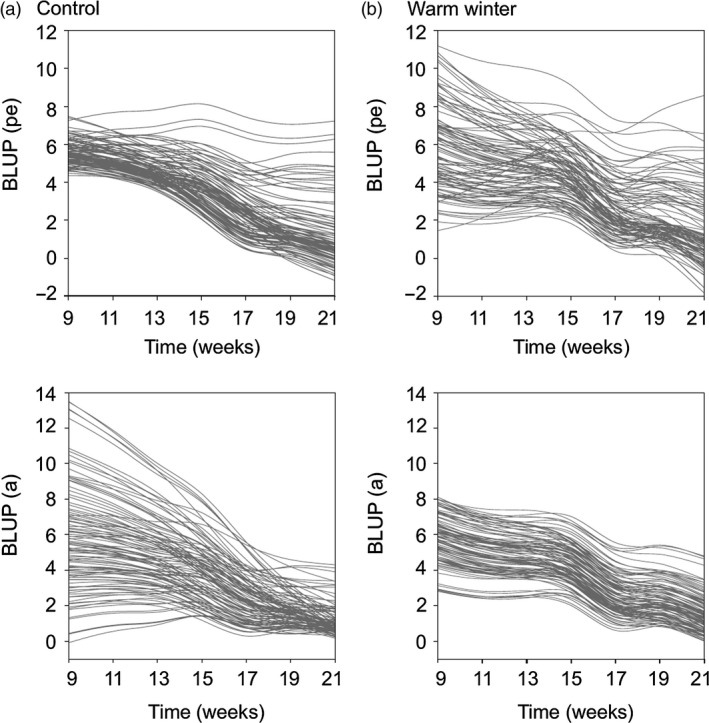
Figure 3.

Reaction norm plots of the trajectories for red coloration over time since the onset of senescence (9th week onwards) of individual male sticklebacks from the (a) control and (b) warm winter temperature treatments (control: N = 104 individuals; warm winter: N = 105). Each line represents the predicted trajectory of a single individual either at the permanent environment (pe) or additive genetic (a) level. Trajectories are based on the fixed effects (average trait and ageing rate) and individual‐specific elevation and slope from the best linear unbiased predictor (BLUP) values of model 5 in Table 2. BLUPs are used here to merely illustrate the PE × T × E and G × T × E patterns, but were not used in the statistical analyses.
