Figure 2.

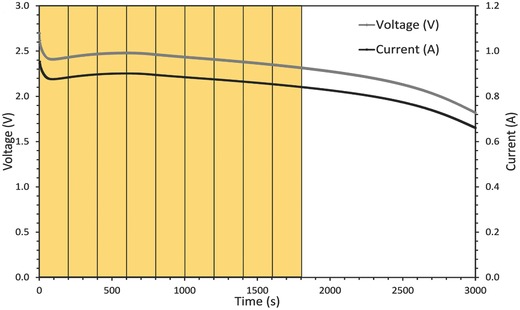
Discharge curve of the CR2 cell at constant resistance of 2.75 Ω. The yellow segments indicate the time between consecutive volume images which were correlated using DVC.

Discharge curve of the CR2 cell at constant resistance of 2.75 Ω. The yellow segments indicate the time between consecutive volume images which were correlated using DVC.