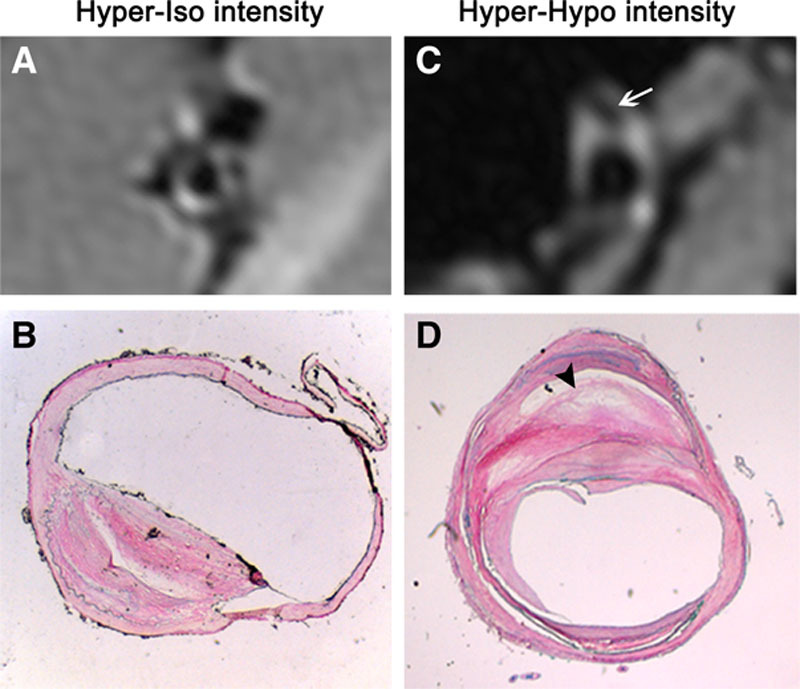
Figure 1.

Representative magnetic resonance (MR) images of atherosclerotic plaque and their corresponding histopathologic sections. Fat-suppressed T1-weighted image (A) reveals a hyper-iso intensity plaque, which is suggestive as a fibrous cap atheroma (B). Fat-suppressed T1-weighted image (C) indicates a hyper-hypo intensity plaque, which is classified into thin fibrous atheroma on matched histological image (D). Area with low signal on MR image (arrow in C) is verified to be lipid core on corresponding histopathologic section (arrowhead in D).
