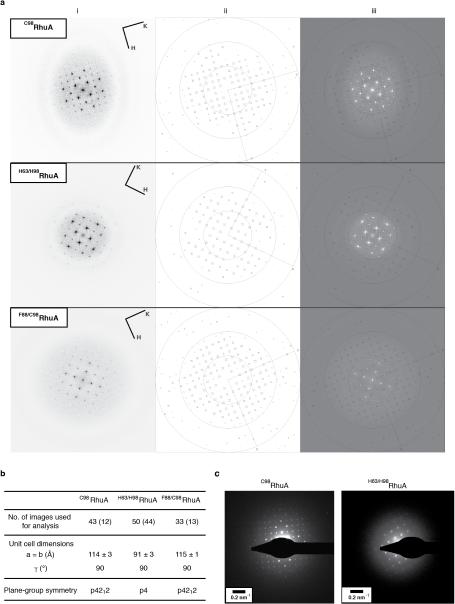
Extended Data Figure 8. Crystallographic analysis of the 2D lattices of RhuA variants.
a, (i) Representative Fourier transforms calculated from the full field of view of crystal images, displayed up to 10 Å. The reflections are consistent with the plane group symmetries estimated from the analysis of the phase residuals (see Supplementary Data Table 4). (ii) IQ-plot calculated from spectrum at left. Size of boxes around reflections reflects their IQ value, defined as ratio of the reflection peak amplitude and the amplitude of the background signal around each peak (R. Henderson et al., Ultramicroscopy 19, 147-178 (1998)). The most significant reflections are labeled with their IQ values, 1–4. Rings are displayed at resolutions of 30, 15 and 10 Å. (iii) Overlap of FFT and IQ-plots. b, Crystallographic data for the 2D lattices of RhuA variants. Reported are the numbers of TEM images used for the analysis of plane group symmetry. The numbers in parentheses are the number of images used for determining the statistics for the unit cell dimensions of each lattice. The plane group symmetry was determined by consensus from all of the images available. c, Electron diffraction patterns of C98RhuA and H63/H98RhuA lattices.

