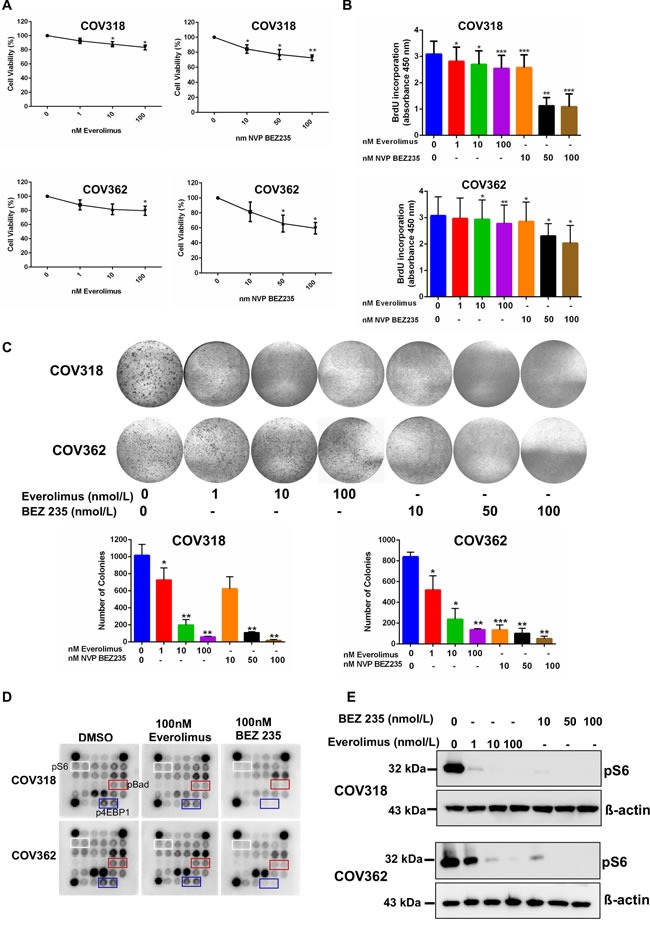
Figure 6. mTOR inhibitors suppress the growth of ovarian cancer cells.

A. COV318 and COV362 cells were treated with increasing doses of mTOR inhibitors, Everolimus and NVP BEZ235. Forty-eight hours later, cell viability was assessed using cell viability assay kit from Promega. The data shown are mean ±SEM of three individual experiments. *P < 0.05, **P < 0.01, Student's t-test. B. Cells treated with mTOR inhibitors were subjected to BrdU incorporation assay. The data represents mean ±SEM of three individual experiments. *P < 0.05, **P < 0.01, ***P < 0.001, Student's t-test. C. COV318 and COV362 cells treated with increasing dose of mTOR inhibitors were subjected to clonogenic assays. The data shown are representative of three individual experiments. Pictures were taken at the same magnification. *P < 0.05, **P < 0.01, ***P < 0.001, Student's t-test. D. COV318 and COV362 cells were treated with DMSO control or 100 nmol/L of Everolimus or BEZ235. Forty-eight hours later, whole cell lysates were subjected to AKT/mTOR signalling antibody protein array. E. Whole cell lysates from COV318 and COV362 cells treated with increasing doses of Everolimus and BEZ235 were subjected to western blot analysis for pS6. The data shown are representative of three individual western blot analyses. β-actin was used as a loading control.
