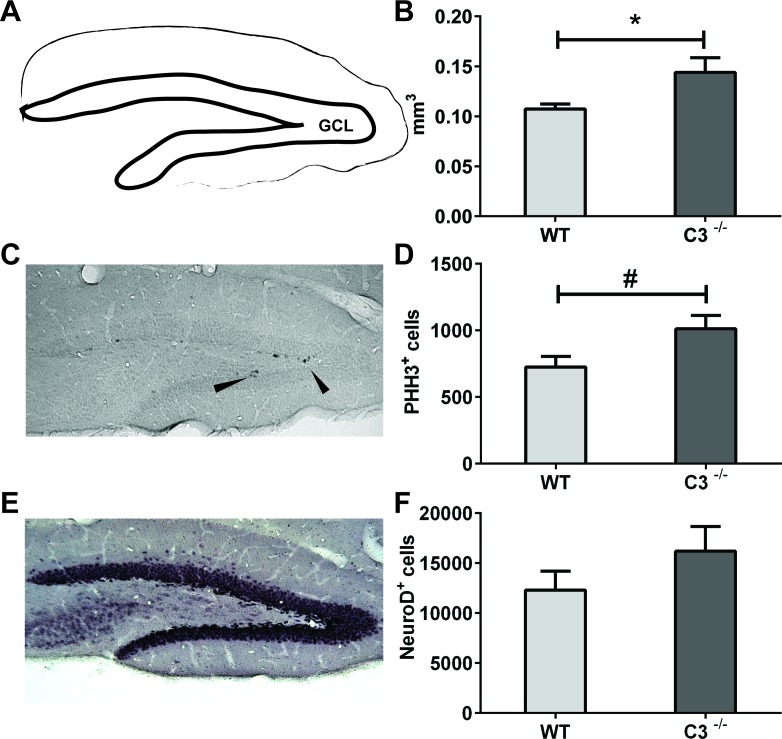
Figure 3. IR-induced changes during the subacute phase.
The volume of GCL A. was measured at P 17 (7 days after IR). B. the average volumes of the GCL. C. A representative microphotograph of phospho-histone H3-positive (PHH3+, proliferating) cells from an irradiated wild type GCL. Arrowheads show immunopositive cells. D. The total numbers of PHH3+ cells in the GCL after IR. E. A representative microphotograph of Neuro D, (neural progenitors and immature neurons) cells from an irradiated wild type GCL. F. The total numbers of Neuro D+ cells in the GCL after IR. Data are shown as mean ± SEM, *P < 0.05, #P = 0.05, n = 5-6 per group. WT = wild type mice, C3−/− = C3-deficient mice, SEM = standard error of the mean.

