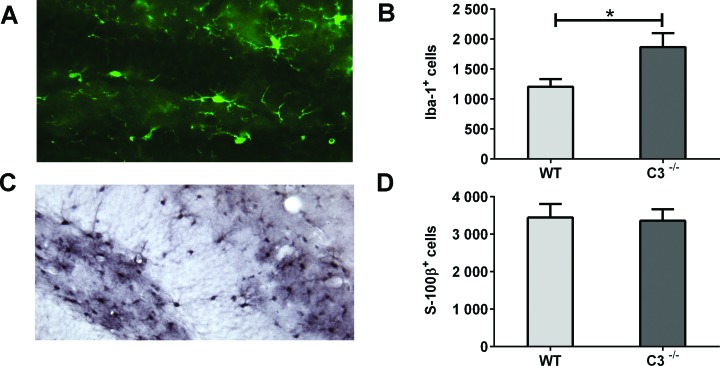
Figure 4. IR-induced changes in the microenvironment during the subacute phase.
A. A representative microphotograph of Iba-1-positive cells (microglia) in the GCL. B. The average numbers of Iba-1-positive cells in the GCL. C. A representative microphotograph of S100β-positive cells (astrocytes) in the DG. D. The average numbers of S100β-positive cells in the GCL. Data are shown as mean ± SEM *P < 0.05, n = 6 per group. WT = wild type mice, C3−/− = C3-deficient mice, SEM = standard error of the mean.

