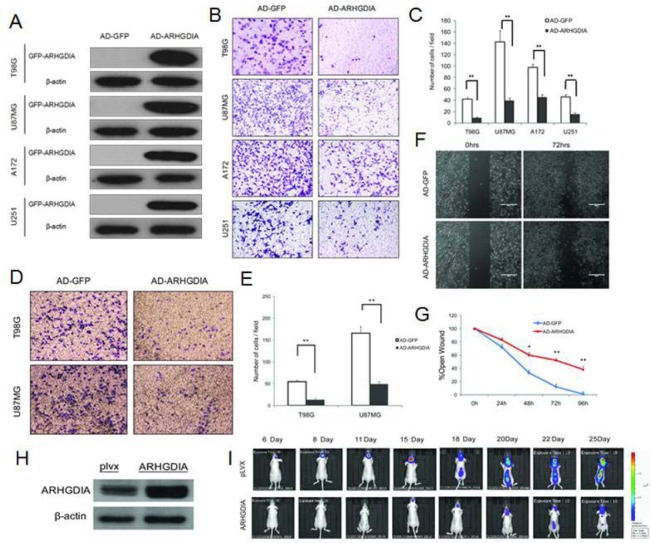
Figure 2. Overexpression of ARHGDIA inhibits glioma migration and invasion.
A. Western blot of GFP-ARHGDIA expression in 4 glioma cell lines (T98G, U87 MG, A172, U251) infected with AD-GFP and AD-ARHGDIA for 48 h. (B., C.) Transwell migration assays of 4 glioma cell lines (T98G, U87 MG, A172, U251) were performed after infection with AD-GFP and AD-ARHGDIA for 48-72 h. The results are representative of at least three independent experiments. Graphs indicate the average number of cells per field of the indicated cell lines in migration assays. Data show the mean ± SD, *P<0.05,**P<0.01. (D., E.) Invasion assays of 2 glioma cell lines (T98G, U87 MG) were performed after infection with AD-GFP and AD-ARHGDIA for 48-72 h. The results are representative of at least three independent experiments. Graphs indicate the average number of cells per field of the indicated cell lines in invasion assays. (F., G.) Wound-healing assays in T98G cells were performed after infection with AD-GFP and AD-ARHGDIA for 0-96 h. Pictures were taken every 24 h. The graph represents the width of the remaining open wound calculated in relation to time 0. (H) Western blot of ARHGDIA expression in plvx-U87 MG and ARHGDIA-U87 MG stable cells for 72 h. I. plvx-U87 MG and ARHGDIA-U87 MG stable transfectants (5×10⁵) were injected intracranially into 10 nude mice and then imaged from day 6 to day 25. Tumor sizes were quantified by in vivo bioluminescence imaging (BLI) in experimental intracranial metastasis models of gliomas.

