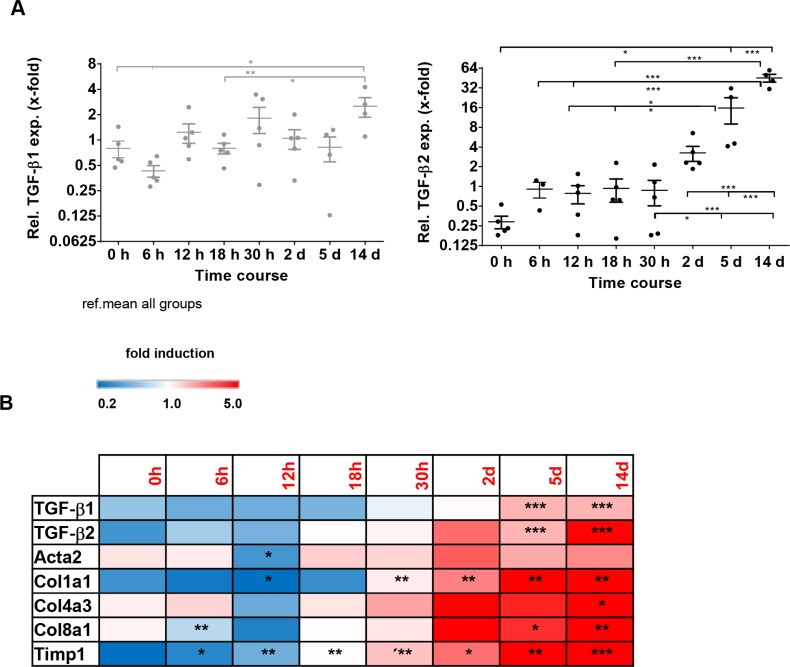
Figure 4. TGF-β1, TGF-β2 and fibrotic marker expression in the bile duct ligation (BDL) model for cholestasis and secondary biliary fibrosis.
(A) TGF-β1 and TGF-β2 expression were determined within a time course of 14 days after bile duct ligation (BDL). Relative expression was normalized to expression of GAPDH and referred to the mean ΔCt of all samples. (B) Fluidigm gene expression analysis of typical fibrotic markers displayed in a heatmap. The color represents the expression level of the gene. Red represents high expression, while blue represents low expression. *p < 0.01; **p < 0.005; ***p < 0.001.

