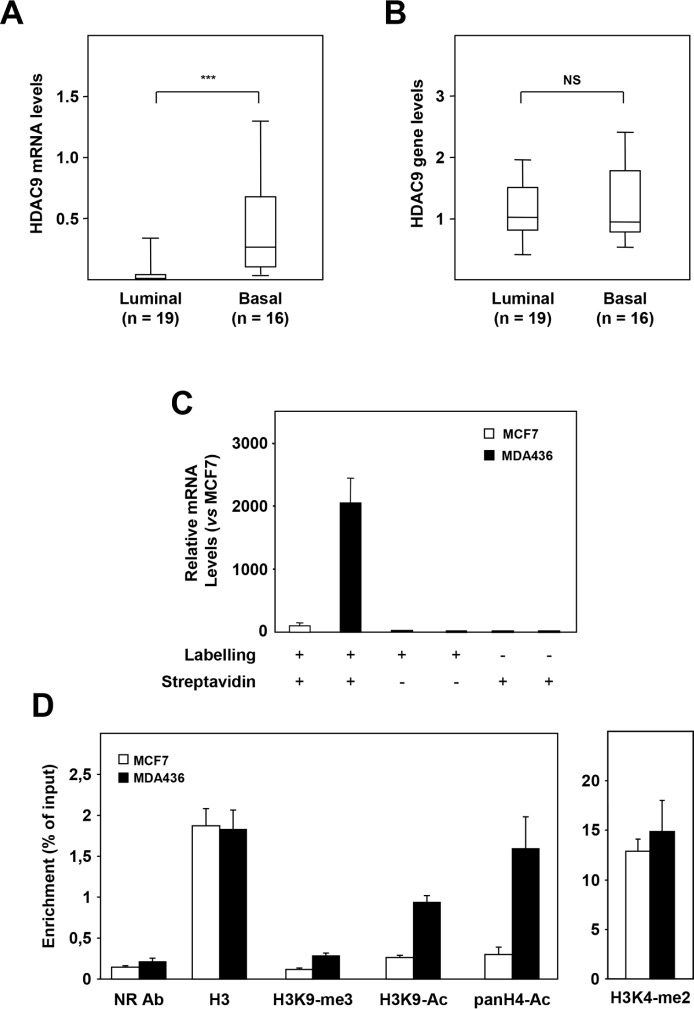
Figure 2. Mechanisms of HDAC9 deregulation in basal breast tumor cells.
A. HDAC9 mRNA levels were measured in luminal (n=19) and basal (n=16) breast tumor cell lines using RT-qPCR as described in Materials and Methods. B. Same as in panel A for HDAC9 gene levels measured by qPCR. C. HDAC9 transcription rates were measured in MCF7 and MDA-MB436 breast tumor cells in a run-on experiment. HDAC9 mRNA levels are expressed relative to the MCF7 cell line used as reference. The various experimental conditions used for both cell lines are indicated. D. ChIP experiments on the HDAC9 gene promoter after immunoprecipitation using antibodies against Histone H3 (H3), H3K9-me3, H3K9-Ac, panH4-Ac, H3K4-me2 or an irrelevant antibody (NR Ab).*** p < 0.001.

