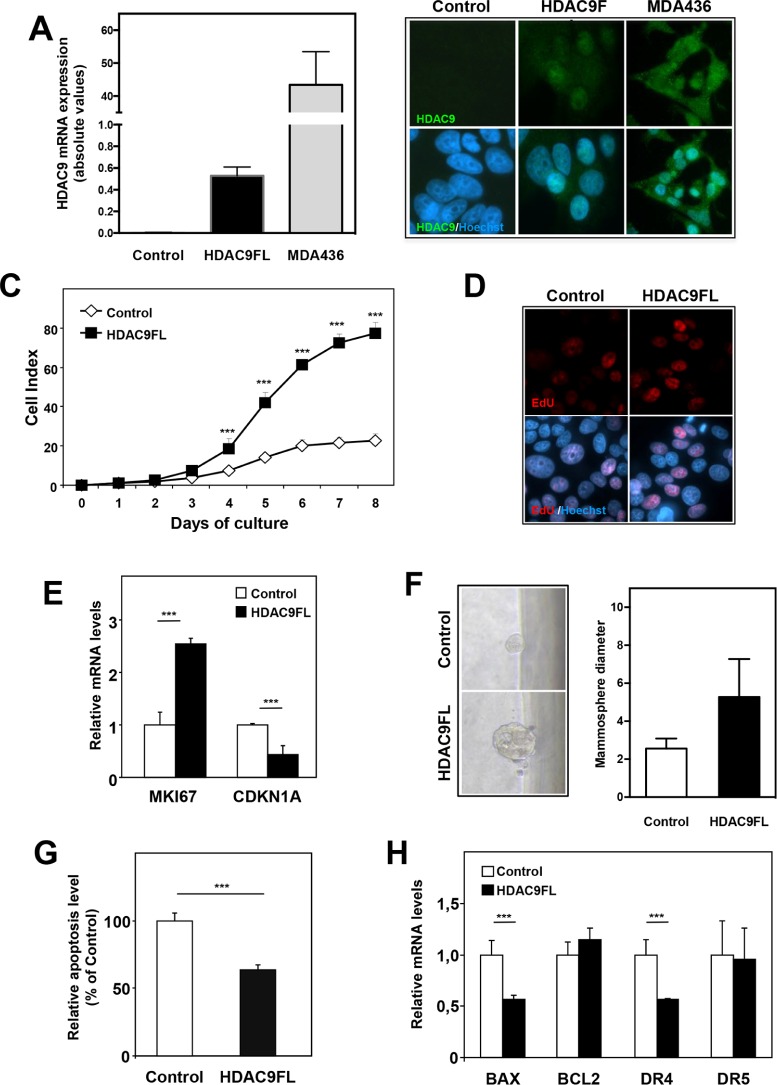
Figure 3. HDAC9 regulates cell proliferation and apoptosis in breast cancer cells.
A. HDAC9 mRNA levels were quantified using RT-qPCR in MCF7 cells stably transfected using either control plasmid (Control) or full length HDAC9 plasmid (HDAC9FL) and in MDA-MB436 cells. Results are expressed in arbitrary units (AU) as mean ± SD of 6 independent cell cultures. B. MCF7-Control, MCF7-HDAC9FL and MDA-MB436 were analyzed by immunofluorescence using anti-HDAC9 antibody and Hoechst labeling. C. Cell index corresponding to the number of MCF7-Control and MCF7-HDAC9FL viable cells were monitored every 24 hours during 8 days using the xCELLigence system. Values are means ± SD, n=3 independent experiments. D. Proliferating cells in MCF7-Control and MCF7-HDAC9FL were analyzed by immunofluorescence using EdU and Hoechst labeling. E. Ki67 and p21 mRNA levels were quantified using RT-qPCR. Results represent fold change ± SD of 6 independent cell cultures vs levels in MCF7-Control cells after normalization to 28S mRNA. F. Mammosphere growth was analyzed in non-adherent conditions using MCF7-Control and MCF7-HDAC9FL cells. Values represent mammosphere diameter (mean ± SD of 34 values; n=3 independent experiments). G. Basal apoptosis was measured using the Cell Death Detection ELISA kit. Results are expressed relative to MCF7-Control cells (100%) and represent mean ± SD of 4 wells; n=3 independent experiments. F- BAX, BCl2, DR4 and DR5 mRNA levels were quantified using RT-qPCR. Results are expressed as in D. *** p< 0.001.

