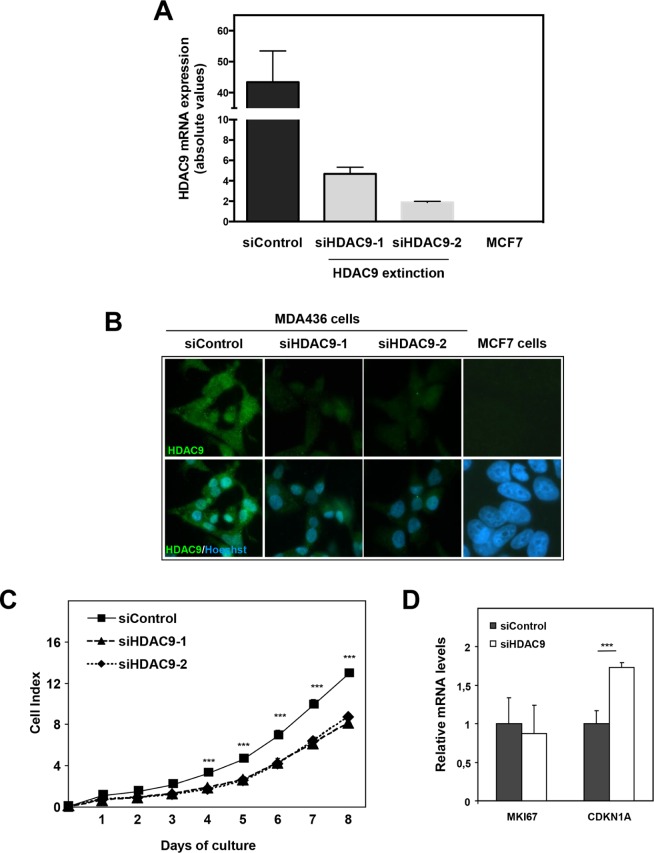
Figure 4. Effect of HDAC9 knock-down on breast cancer cell proliferation.
A. HDAC9 expression was measured by RT-qPCR in MDA-MB436 cells after silencing (siHDAC9-1 and siHDAC9-2) or not (siControl) of the HDAC9 gene. Values represent fold changes ± SD corrected by the 28S mRNA and normalized to control cells. B. The same MDA-MB436 cells were analyzed by immunofluorescence using the anti-HDAC9 antibody. C. Cell index corresponding to the number of MDA436-siControl and MDA436-siHDAC9-1/-2 viable cells were monitored every 24 hours during 8 days using the xCELLigence system. Values are means ± SD, n=3 independent experiments. D. Ki67 and p21 mRNA levels were quantified using RT-QPCR. Results are expressed relative to the mRNA levels measured for the MDA436-siControl cells. *** p< 0.001.

