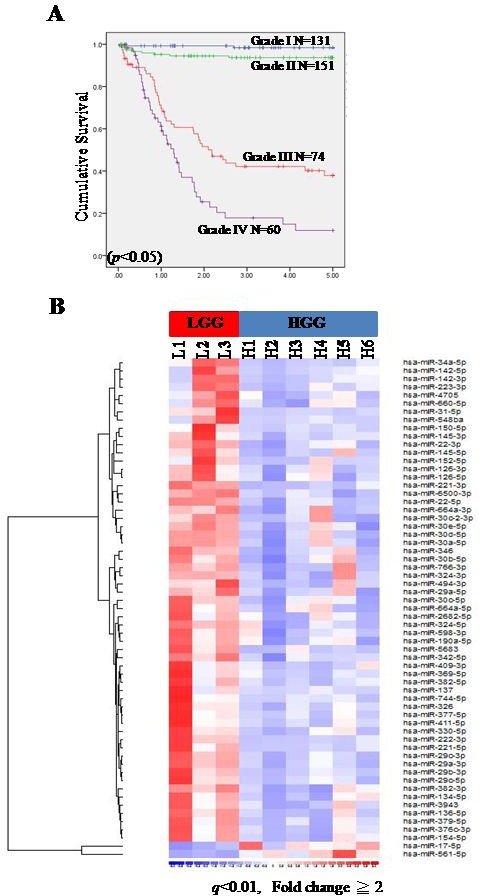
Figure 1. Small RNA sequencing (smRNA-seq) analysis of pediatric gliomas.

Five-year Kaplan-Meier survival curves for pediatric glioma patients at Taipei Veterans General Hospital from 1971-2013 A. Overall survival time was calculated as the time from diagnosis to death or to last follow-up. Blue line: grade I (LGG); green line: grade II (LGG); red line: grade III (HGG); purple line: grade IV (HGG). A heat map illustrating differentially expressed miRNAs between pLGGs (n = 3) and pHGGs (n = 6) B. A total of 59 miRNAs were upregulated in pLGGs and 2 were upregulated in pHGGs.
