
Figure 3. Gene expression microarray analysis of pediatric gliomas.
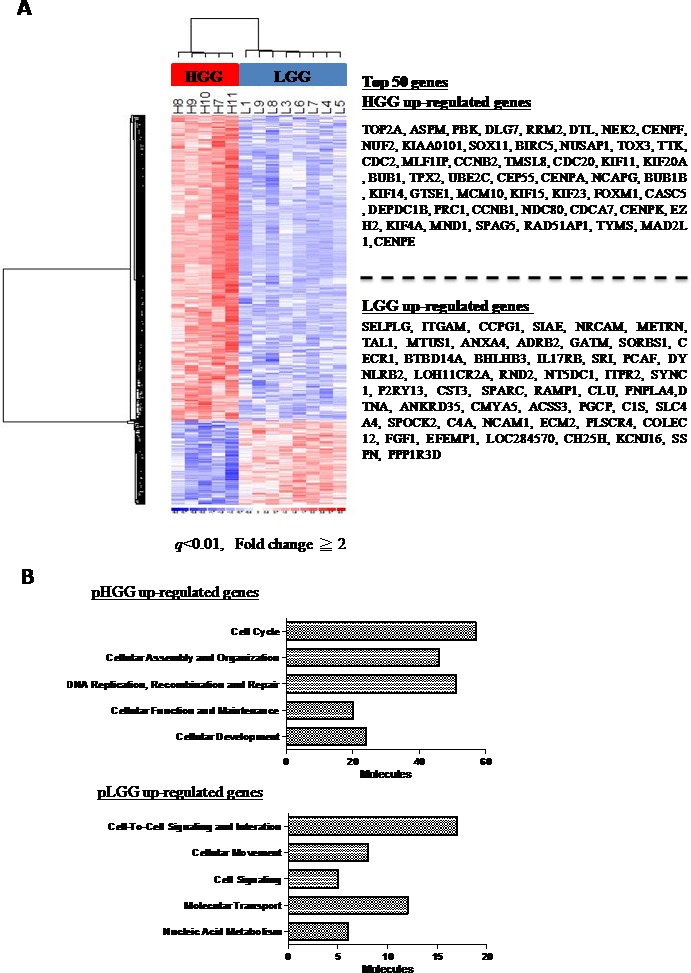
Heat map illustrating the expression of 457 probe sets (q < 0.01, fold change≥2) in five pHGGs and eight pLGGs, with the top 50 genes listed in the right panel A. 264 genes are overexpressed in pHGGs B. and 76 genes are overexpressed in pLGGs C. Genes overexpressed in pHGGs and pLGGs were subjected to Gene Ontology (GO) database searches.