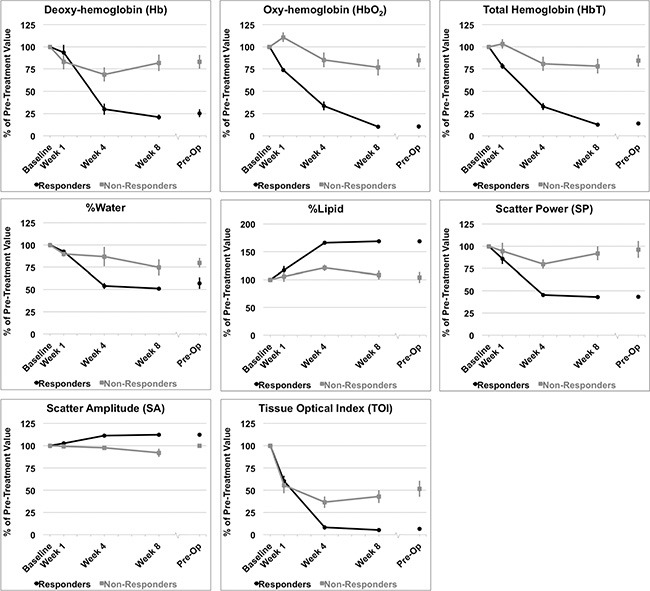
Figure 5. DOSI parameters measured.

Percent changes resulting from treatment effects according to clinical response of patients to neoadjuvant chemotherapy. Hemodynamic and tissue changes within the tumor volume are presented. Error bars = Standard deviation, n = 14 responders and n = 8 non-responders. Significant differences between responders and non-responders were tested at each time interval and parametric changes over time were tested for responders and non-responders [Table 2].
