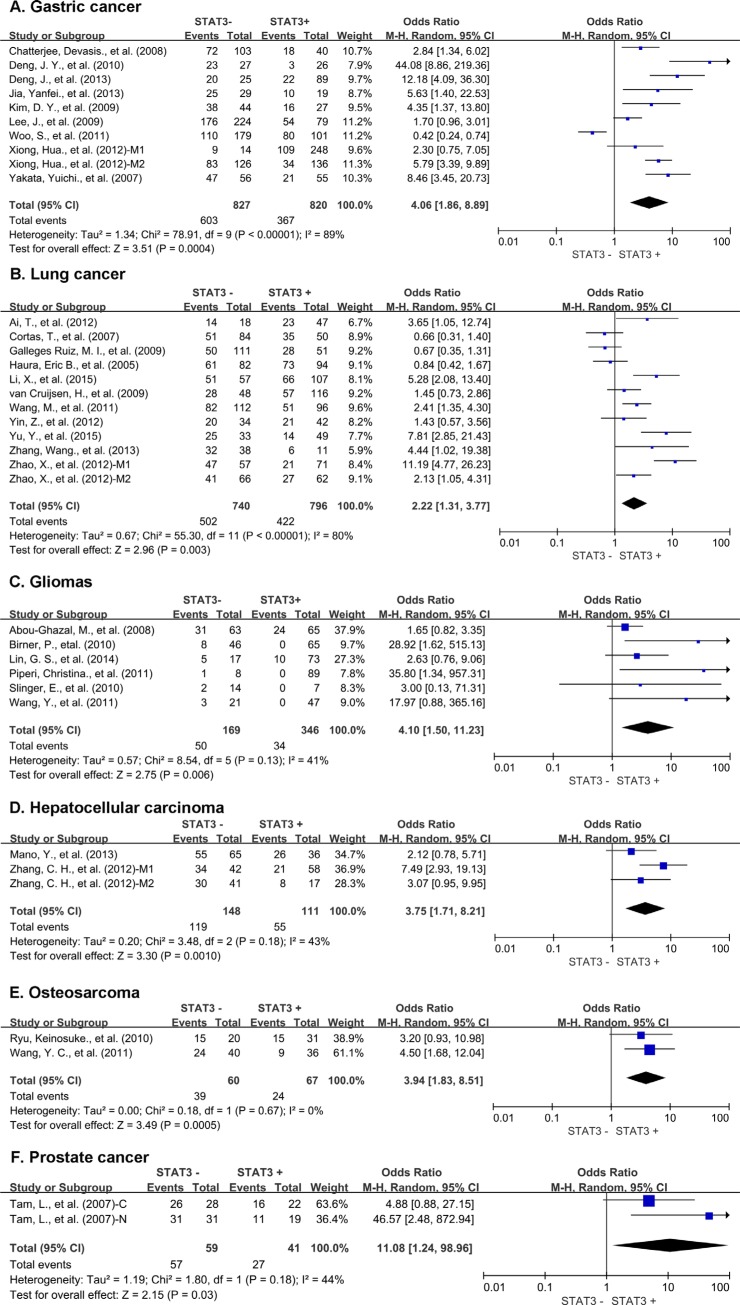
Figure 3. Subgroup analysis of 3-year OS by STAT3 expression in different tumor types.
(A) gastric cancer; (B) lung cancer; (C) gliomas; (D) hepatic cancer; (E) osteosarcoma; (F) prostate cancer. M1: Marker 1, STAT3; M2: Marker 2, p-STAT3; 1: Cohort 1; 2: Cohort 2 N: nuclear expression; C: cytoplasmic expression.

