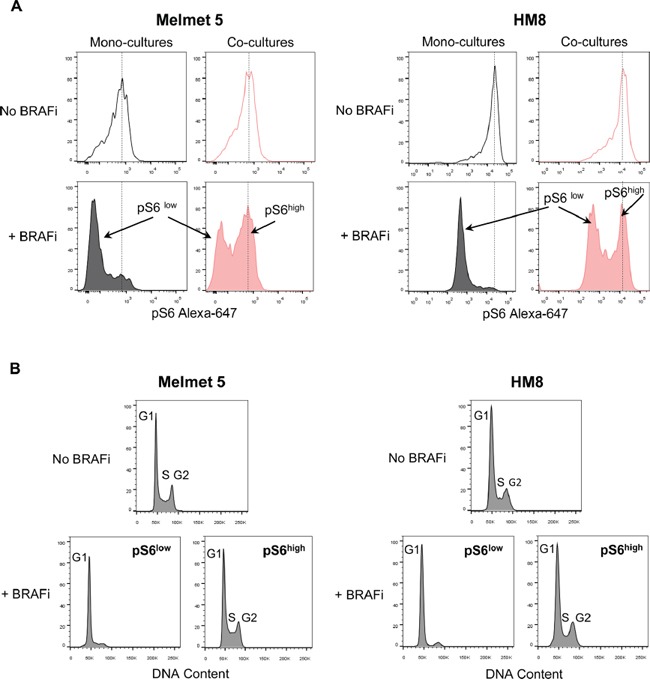
Figure 7. Flow cytometric analysis of pS6 levels and cell cycle in melanoma cells from mono-cultures and co-cultures with fibroblasts.

Melanoma cells were grown as mono-cultures or co-cultures with fibroblasts, treated with 1 μM BRAFi for 24 h (controls were not treated) before the total cell suspension was analyzed for pS6 levels (A) and cell cycle (B). A. Representative histograms indicating pS6 levels in single melanoma cells; dotted lines designate the histogram peak position in the non-treated cells. B. DNA content (i.e. cell cycle distribution) in non-treated and BRAFi treated melanoma cells from the co-cultures, where the latter were divided into subpopulations with low (pS6low) and high (pS6high) levels of pS6.
