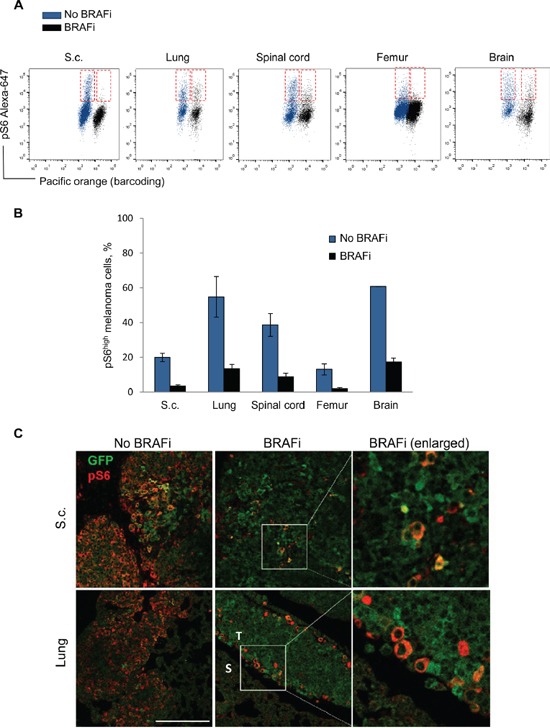
Figure 9. Analysis of pS6 in melanoma cells from distinct sites in vivo.

Melmet 5 melanoma cells were allowed to grow in distinct organs in mice with/without treatment with BRAFi. The metastatic organs and s.c. tumors were collected and analyzed by flow cytometry (A, B) or immunofluorescence (C). A. Representative dot-plots showing pS6 levels in Melmet 5 cells from non-treated (blue) and treated (black) animal organs. The pS6high melanoma cell subpopulations are indicated in red boxes. B. The bars indicate average percentage of pS6high cells ± SEM (n=3/4), except for the brain samples, where average ± St.Dev. (n=2) is shown. C. Immunofluorescence for pS6 (red) and GFP (green) in s.c. tumors (upper panels) and lung metastases (lower panels; S, stromal region; T, tumor region) derived from non-treated and BRAFi treated animals. The pictures show an overlay of pS6 and GFP. Scale bar, 200μm.
