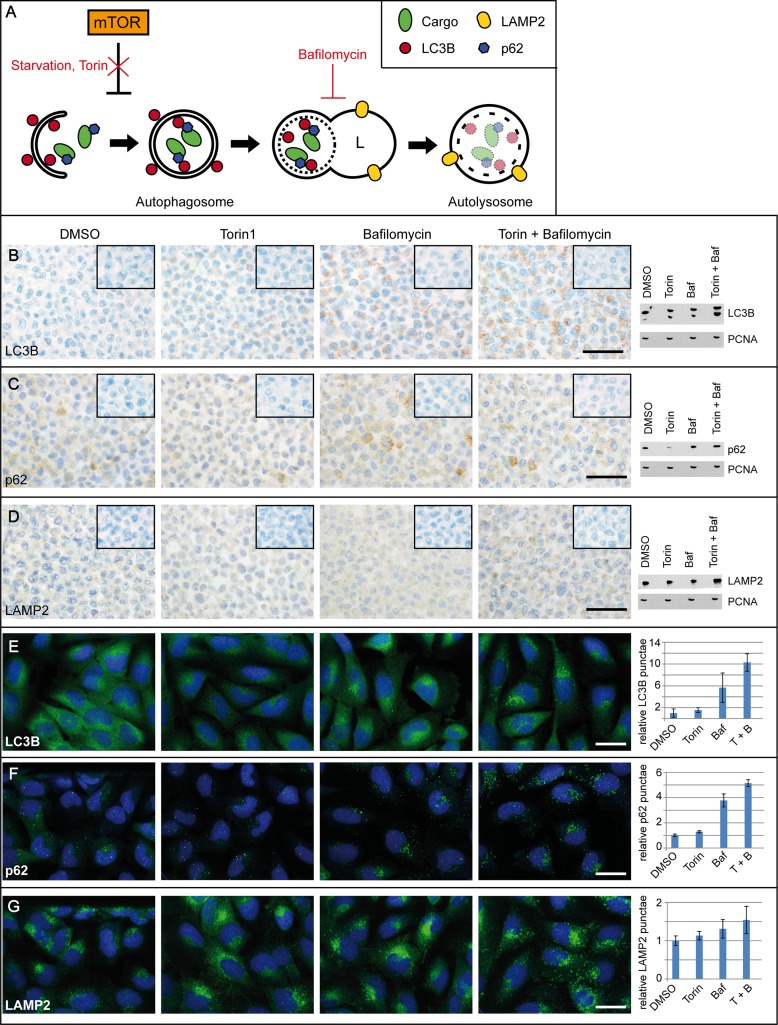
Figure 1. Platform for the immunocytochemical analyses of key autophago-lysosomal markers.
(A) Schematic overview of the autophago-lysosomal pathway including modulators of the induction of autophagy as well as inhibitors of the autophagic flux used in Figure 1B–1G. (B–D) Immunohistochemistry with antibodies against (B) LC3B, (C) p62 and (D) LAMP2 in LNT-229 glioma cells treated with DMSO as control condition, the activators of autophagosome formation Torin1 (250 nM) or BafA1 (100 nM) as well as the combination of both Torin1 and BafA1 (treatment time 2 h in each condition). Negative controls of the immunocytochemical stainings are shown in the right upper corner of each picture. Scale bars: 50 μm. Corresponding immunoblots were performed from each treatment condition. (E–G) LNT-229 glioma cells were treated with Torin1 (2 h, 250 nM) and/or BafA1 (2 h, 100 nM), fixed and labeled with (E) anti-LC3B, (F) anti-p62 or (G) anti-LAMP2 antibodies, respectively. DRAQ5 was used to stain nuclei. Scale bars: 10 μm. Images were acquired with Opera High Content Screening System and antibody-labeled spots were automatically counted using Acapella software. Data represent mean of quadruplicates ± standard deviation, normalized to DMSO control.

