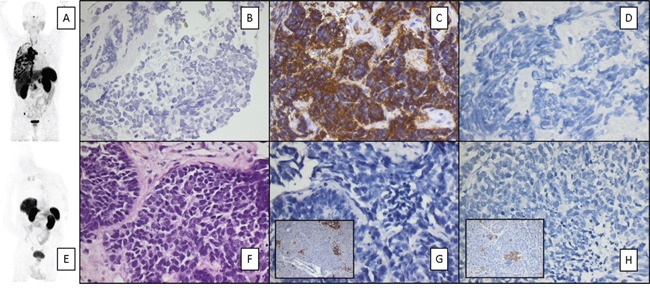
Figure 2. Example of SSTR-directed PET imaging matching immunohistochemical quantification of receptor expression.

Given are maximum intensity projections A, E. and immunohistochemical stainings of SCLC patients with high (Patient # 9, upper row; C) and low (patient #1, lower row; G) SSTR 2a expression. SSTR5 expression was low in both samples D, H. Positive controls for both SSTR2a and SSTR5 are shown in the inserts in panels G and H. Counterstaining was performed with hematoxylin B, F. Magnification: 200x B, F. and 400x C-H.
