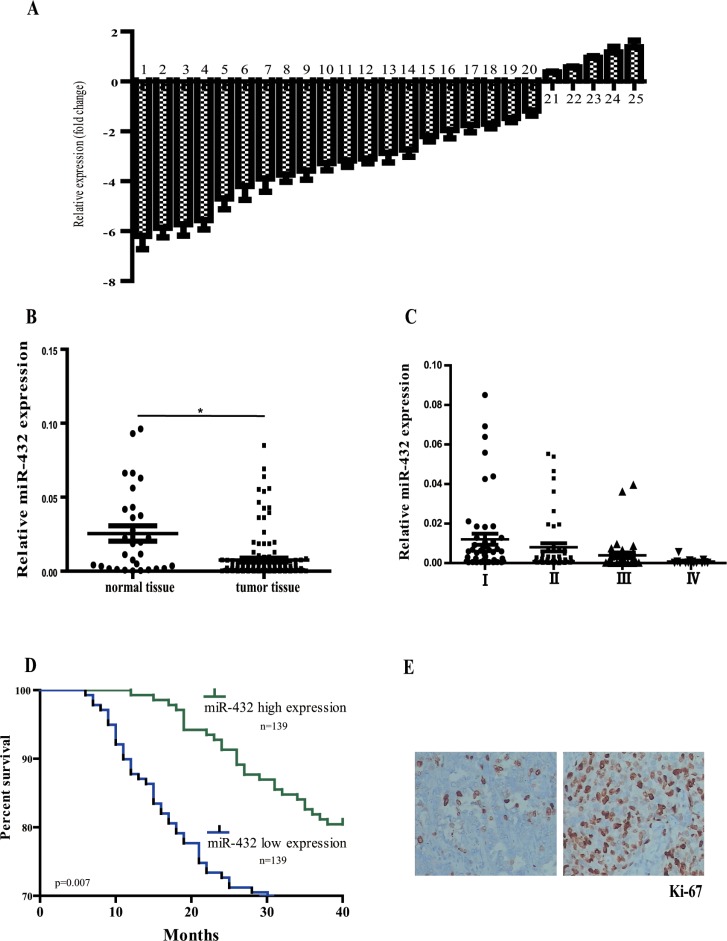
Figure 1. Relative miR-432 expression levels in LAD tissues and its clinical significance.
(A) Quantitation of 25 miRNAs were performed using RT-qPCR in three matched-pairs of primary tumor and its surrounding normal tissues and the results are shown as folds number in metastatic to primary ones. 1–25 represents miR-329, miR-202, miR-432, miR-302, miR-1470, miR-290, miR-514, miR-184, miR-625, miR-382, miR-689, miR-1224, miR-502, miR-299, miR-720, miR-187, miR-718, miR-520, miR-582, miR-105, miR-190, miR-324, miR-350, miR-106 and miR-4773, respectively. (B) miR-432 was detected in LAD and normal tissues by RT-qPCR. (C) miR-432 expression was progressively depressed in LAD tissues with the pathological stages increased. Results represent the means of the values. Bars indicate s.d. (D) Patients with high levels of miR-432 expression showed increased survival times compared with patients with low levels of miR-432 expression. (E) Ki-67 expression was measured by immunohistochemistry from tumors to evaluate the proliferation ability of tumor cells. *p < 0.05.

