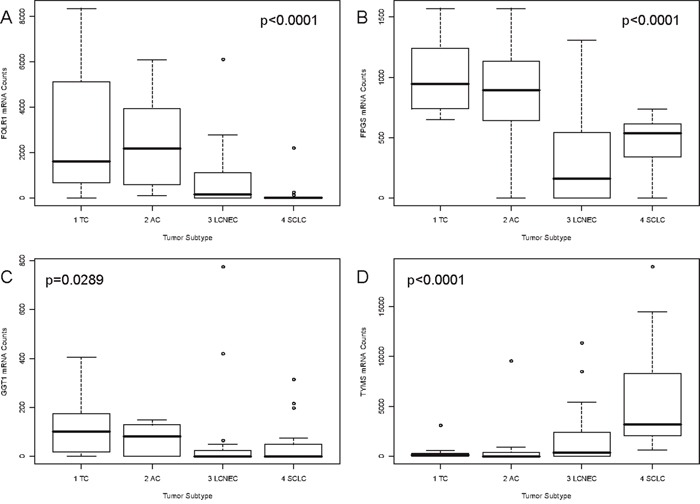
Figure 2. Correlation of FOLR1, FPGS, GGT1 and TYMS mRNA expression and tumor subtype.

Associations between the tumor subtype and gene expression of A. FOLR1, B. FPGS, (upper line), C. GGT1 and D. TYMS (lower line) are pictured as boxplots. On the x-axis the four investigated tumor subtypes are depicted. The y-axis shows the mRNA counts measured by the nCounter technology. The p-value is based on a Kruskal-Wallis rank sum test and is rounded to the fourth decimal place. FOLR1 and GGT1 expression decreased with increasing malignancy from TC to SCLC. The opposite was found for TYMS. FPGS showed higher expression in carcinoids than in carcinomas.
