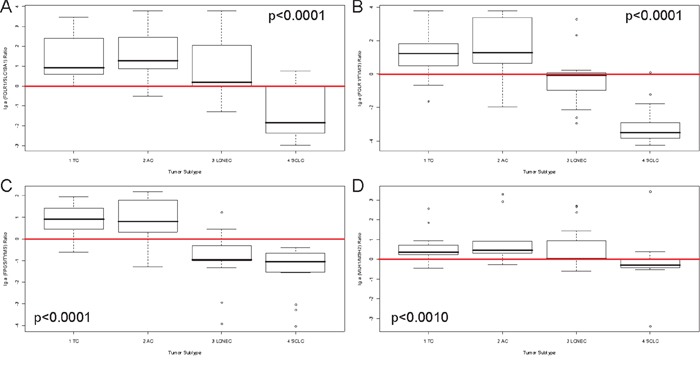
Figure 3. Ratios of members of folic acid metabolism and DNA repair discriminate different subtypes of pulmonary neuroendocrine tumors.

The natural logarithmical scaled ratios for A. FOLR1/SLC19A1, B. FOLR1/TYMS, C. FPGS/TYMS and D. MLH1/MSH2 are shown (y-axis) in correlation to the four investigated tumor subtypes (x-axis). The p-value is based on a Kruskal-Wallis rank sum test and is rounded to the fourth decimal place. A red line depicts the x-axis at the zero-point. The ratio depicted in A. differentiate SCLC from the other entities, indicating that SCLC use SLC19A1 as predominant receptor for uptake of folic acids. The ratios in B. and C. identify higher FOLR1 and FPGS, but lower TYMS expression in carcinoids. In carcinomas, higher TYMS expression is found, whereas FOLR1 and FPGS are considerably reduced.
