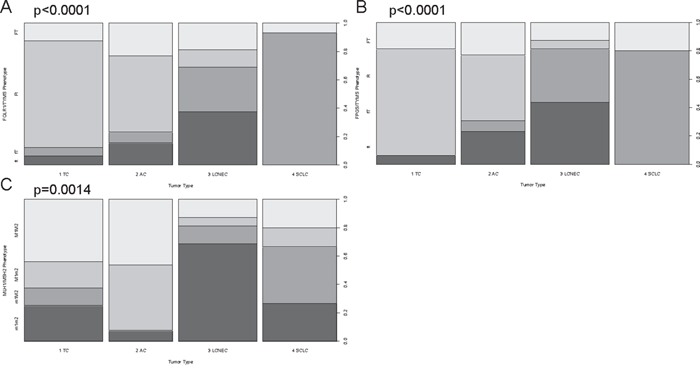
Figure 4. Phenotypic sorting reveals differential expression patterns between carcinoids and carcinomas.

The phenotypic distribution for A. FOLR1/TYMS, B. FPGS/TYMS and C. MLH1/MSH2 is shown for each tumor entity. Phenotypic sorting was performed by classifying expression below the median with a lowercase letter (f, t, m1, m2) and expression above the median with a capital letter (F, T, M1, M2): (FOLR1 (median=313 counts), FPGS (median=665 counts), TYMS (median=341 counts), MLH1 (median=850 counts), MSH2 (median=612 counts)). A. and B. show the folic acid phenotypes, whereas C. depicts the DNA repair phenotype. On the x-axis the four investigated tumor types are displayed. The y-axis depicts the percentaged distribution of each phenotype. The p-value is based on a Pearson's Chi-squared test and is rounded to the fourth decimal place. Approximately 90% of all TC and more than 75% of AC belong to the Ft- or FT-phenotype indicating high expression of FOLR1 and FPGS, but low TYMS predestining them for a pemetrexed treatment. LCNEC present in equal shares ft- and fT-phenotypes making them resistant against pemetrexed. In >95% of SCLC the fT-phenotype was present revealing why pemetrexed therapy is no option for this entity. With respect to DNA repair, LCNEC and SCLC present with the m1m2- and m1M2-phenotype in >65% of all cases, which is linked to platin resistance.
