
Figure 10. HUVEC conditioning of surface expression by Caki-1 membrane proteins.
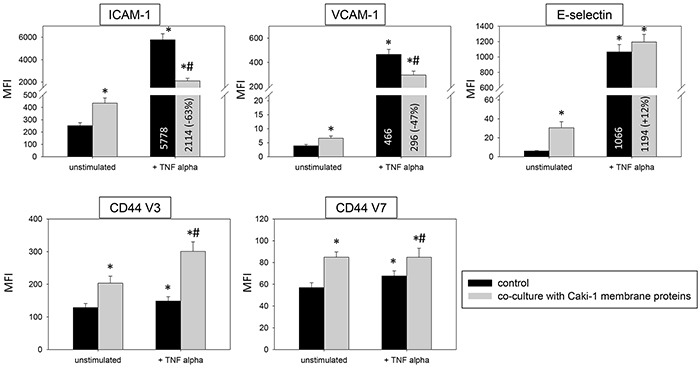
FACscan analysis of ICAM-1, VCAM-1, E-selectin, CD44 V3 and CD44 V7 after 12h TNF alpha [500 U/ml] stimulation and/or co-cultivation with Caki-1 membrane proteins. MFI = mean relative fluorescence intensity. *indicates significant difference to untreated controls. #indicates significant difference to TNF-alpha stimulated HUVEC. n=5.