
Figure 6. Glut-1 analysis of CNE1 and CNE2 tumor sections before and 24 h, 48 h after irradiation.
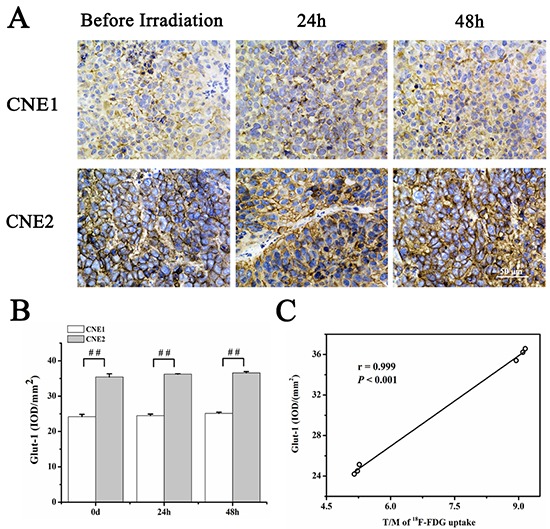
Representative captures of Glut-1 staining A. Glut-1 intensity in both CNE1 and CNE2 groups at different time points B. Correlation analysis between T/M of 18F-FDG uptakes and Glut-1 expression C. # P<0.01, between CNE1 and CNE2 groups.