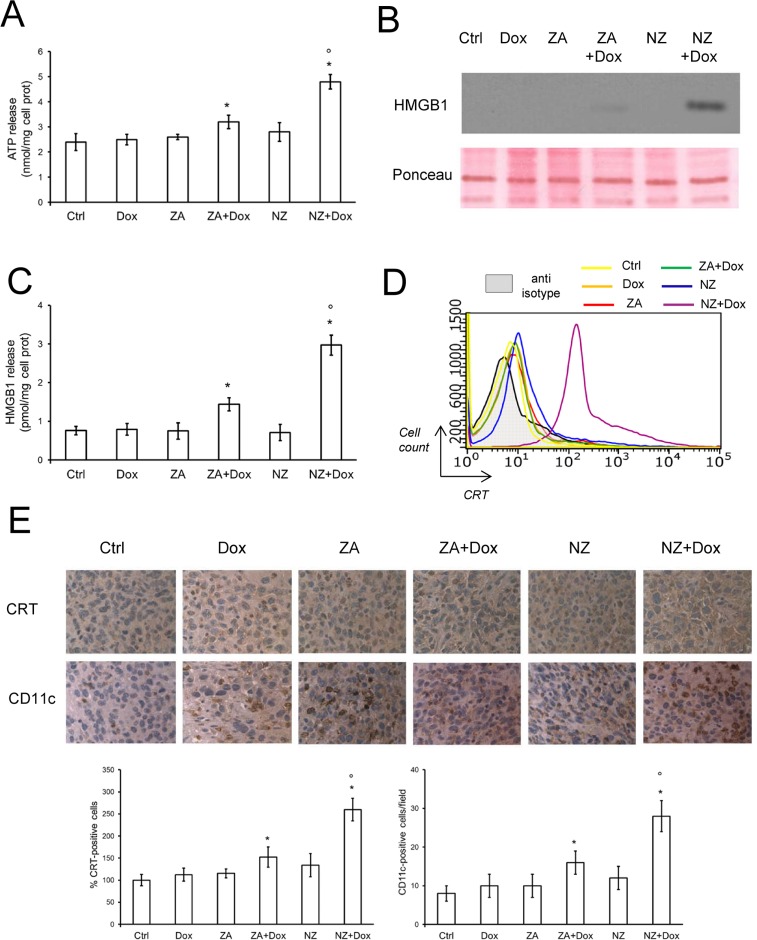
Figure 6. NZ restores the doxorubicin-induced immunogenic death in chemoresistant tumors.
(A) JC cells were grown in fresh medium (Ctrl) or medium containing 5 μmol/L doxorubicin (Dox, 24 h), 1 μmol/L zoledronic acid (ZA, 48 h), 1 μmol/L ZA for 24 h followed by 5 μmol/L doxorubicin for additional 24 h (ZA + Dox), 1 μmol/L self-assembling ZA formulation (NZ, 48 h), 1 μmol/L NZ for 24 h followed by 5 μmol/L doxorubicin for additional 24 h (NZ + Dox). The extracellular release of ATP was measured by a chemiluminescence-based assay. Data are presented as means + SD (n = 3). Versus Ctrl: *p < 0.05; versus Dox: °p < 0.001. (B) Western blot analysis of HMGB1 in the cell supernatants. Red Ponceau staining was used to check the equal loading of proteins. The figure is representative of 3 experiments. (C) The extracellular release of HMGB1 was measured by ELISA. Data are presented as means + SD (n = 3). Versus Ctrl: *p < 0.005; versus Dox: °p < 0.001. (D) Surface calreticulin (CRT) was measured by flow cytometry in duplicate. The figure is representative of 3 experiments. Anti-isotype: incubation with non immune isotypic antibody, included as negative control. (E) Six weeks-old female BALB/c mice bearing 60 mm3 JC-luc tumors were randomly divided into the following groups (10 mice/group): 1) Ctrl group, treated with 0.1 mL saline solution i.v. at day 3, 9, 15; 2) Dox group, treated with 5 mg/kg doxorubicin i.v. at day 3, 9, 15; 3) ZA group, treated with 20 μg/mouse ZA i.v. at day 2, 8, 14; 4) ZA + Dox group, treated with 20 μg/mouse ZA i.v. at day 2, 8, 14 followed by 5 mg/kg doxorubicin i.v. at day 3, 9, 15; 5) NZ group, treated with 20 μg/mouse self-assembling ZA formulation i.v. at day 2, 8, 14; 6) NZ + Dox group, treated with 20 μg/mouse NZ i.v. at day 2, 8, 14 followed by 5 mg/kg doxorubicin i.v. at day 3, 9, 15. Sections of tumors from each group of animals were immunostained for CRT or CD11c, a marker of dendritic cells. Nuclei were counter-stained with hematoxylin. Bar = 10 μm (63× objective). The photographs are representative of sections from 5 (for CRT) or 10 (for CD11c) tumors/group. The percentage of CRT-positive cells was determined by analyzing sections from 5 animals of each group (108–76 cells/field), using Photoshop program. The intensity of Ctrl group was considered 100%. The number of CD11c-positive cells/field was calculated by analyzing sections from 10 animals of each group (114–71 cells/field), using ImageJ software (http://imagej.nih.gov/ij/). Data are presented as means + SD. Versus Ctrl group: *p < 0.05; versus Dox group: °p < 0.001.

