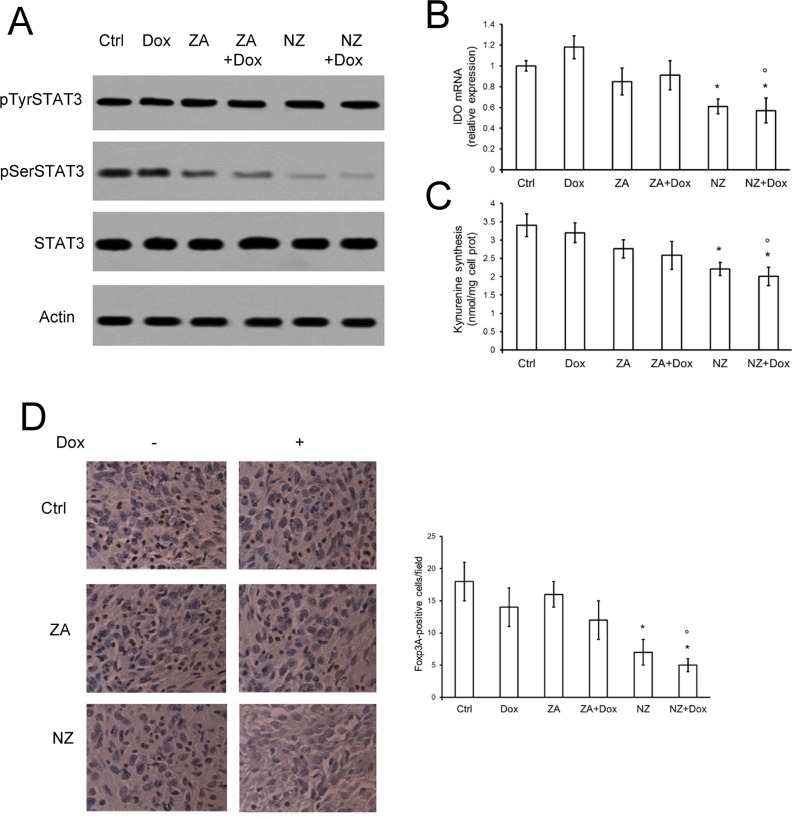
Figure 7. NZ counteracts the tumor-induced immunosuppressive microenvironment.
Six weeks-old female BALB/c mice bearing 60 mm3 JC-luc tumors were randomly divided into the following groups (10 mice/group): 1) Ctrl group, treated with 0.1 mL saline solution i.v. at day 3, 9, 15; 2) Dox group, treated with 5 mg/kg doxorubicin i.v. at day 3, 9, 15; 3) ZA group, treated with 20 μg/mouse ZA i.v. at day 2, 8, 14; 4) ZA + Dox group, treated with 20 μg/mouse ZA i.v. at day 2, 8, 14 followed by 5 mg/kg doxorubicin i.v. at day 3, 9, 15; 5) NZ group, treated with 20 μg/mouse self-assembling ZA formulation i.v. at day 2, 8, 14; 6) NZ + Dox group, treated with 20 μg/mouse NZ i.v. at day 2, 8, 14 followed by 5 mg/kg doxorubicin i.v. at day 3, 9, 15. (A) Tumor extracts were subjected to the Western blot analysis for phospho(Tyr705)-STAT3, phospho(Ser727)-STAT3, total STAT3. The actin expression was used as control of equal protein loading. The figure is representative of 4 tumors per each group. (B) IDO mRNA levels were detected in each tumor extract (n = 10/group) by qRT-PCR. Data are presented as means + SD. Versus Ctrl group: *p < 0.01; versus Dox group: °p < 0.01. (C) The release of kynurenine in the tumor supernatants was measured spectrophotometrically (n = 10/group). Data are presented as means + SD. Versus untreated Ctrl group: *p < 0.02; versus Dox group: °p < 0.02. (D) Sections of tumors from each group of animals were immunostained for Foxp3A, a marker of Treg cells. Nuclei were counter-stained with hematoxylin. Bar = 10 μm (63× objective). The photographs are representative of sections from 10 tumors/group. The number of Foxp3A-positive cells/field was calculated by analyzing sections from 10 animals of each group (111–75 cells/field), using ImageJ software (http://imagej.nih.gov/ij/). Data are presented as means + SD. Versus Ctrl group: *p < 0.02; versus Dox group: °p < 0.005.

