
Figure 2. Human MIF and mouse Ddx6 are strongly anti-correlated and are identified as cross-species hubs.
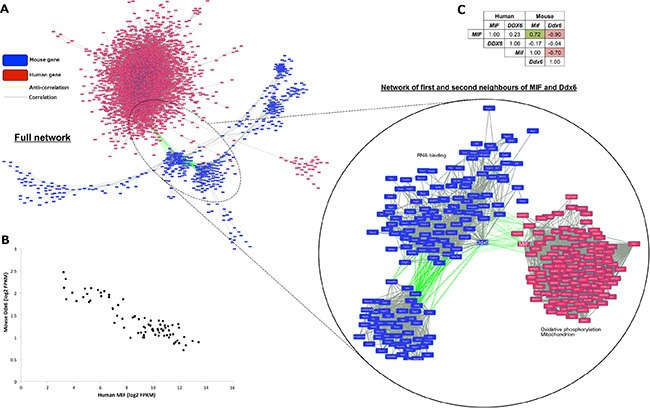
(A) Cytoscape [59] rendered human (red boxes) and mouse (blue) gene co-expression network where nodes are genes and edges indicate gene pairs achieving r > 0.85 (grey) or r < −0.85 (green). Magnified view shows sub-network of first and second neighbors of human MIF and mouse Ddx6. (B) scatterplot showing anti-correlation (r = −0.90) between human MIF and mouse Ddx6. (C) r-values between all combinations of human/mouse MIF and DDX6 mRNA expression profiles.