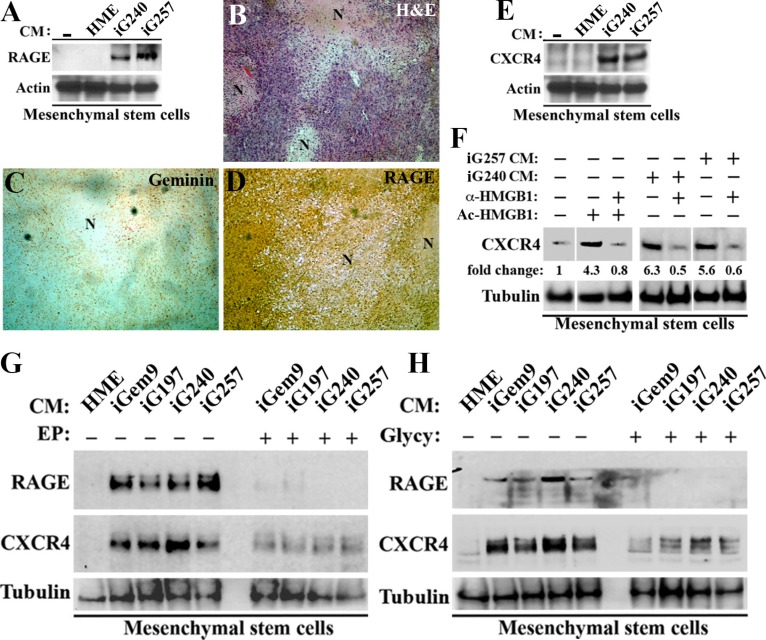
Figure 5. GemOE tumor cells induce MSCs to express RAGE and CXCR4.
(A) The levels of RAGE on the surface of early passage MSCs following exposure to none (−), naïve HME, iG240 or iG257 CM for 24 h. (B–C) adjacent sections from GemOE orthotopic mammary tumor stained with H & E (B) or immunohistochemically stained with geminin (C) or RAGE (D). Note that as oppose to geminin staining that is detected in mammary cells only, RAGE staining is detected in mammary cells as well as stromal cells recruited into these tumors in vivo. (E) The levels of CXCR4 on the surface of early passage MSCs following exposure to none (−), naïve HME, iG240 or iG257 CM for 24 h. (F) The levels of CXCR4 on the surface of early passage MSCs following exposure to none (lane 1), 10 μg/ml Ac-rHMGB1 (lane 2), 10 μg/ml Ac-rHMGB1 + 10 μg/ml HMGB1 NeuAb (lane 3), iG240 CM alone (lane 4) or + 10 μg/ml HMGB1 NeuAb (lane 5), iG257 CM alone (lane 6) or + 10 μg/ ml HMGB1 NeuAb (lane 7) for 24 h. (G) The levels of RAGE and CXCR4 on the surface of early passage MSCs following exposure to naïve HME, iGem9, iG240 or iG257 CM for 24 h in the absence (−) or presence (+) of 200 μM EP. (H) The levels of RAGE and CXCR4 on the surface of early passage MSCs following exposure to naïve HME, iGem9, iG240 or iG257 CM for 24 h in the absence (−) or presence (+) of 200 μM Glycyrrhizin. In all parts of the figure experiments were done between 2–3 separate times.

