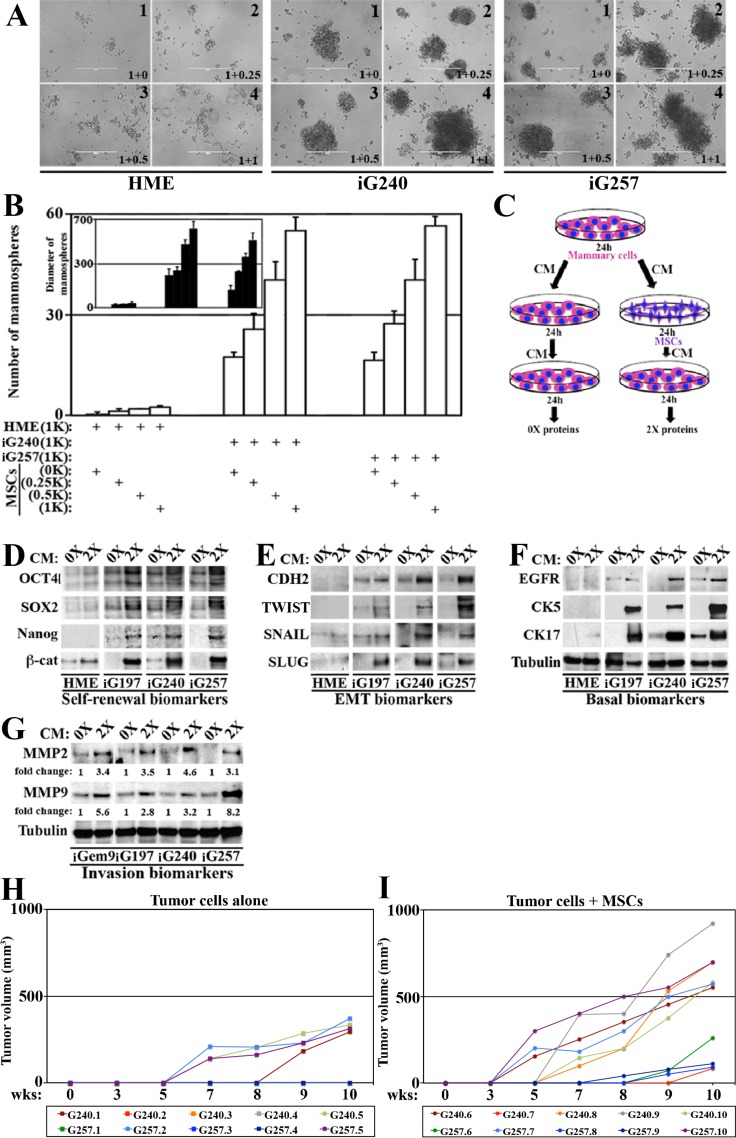
Figure 7. MSCs enhance GemOE aggressiveness, in vitro and in vivo.
(A) Mammosphere formed when 1000 naïve HME, iG240 or iG257 cells were plated alone or mixed with 250, 500 or 1000 MSCs. (B) Quantitative analysis of the data represented in (A). Experiments were done in triplicates 3 different times with p values between 0.0010–0001. Inset shows diameter of mammosphere developed in (A). Experiments were done in triplicates 3 different times with p values between 0.0010–0001. (C) Schematic representation of the experiments described in (D–F). The levels of indicated self-renewal biomarkers (D), EMT biomarkers (E) or basal biomarkers (F) in proteins extracted from naïve HME, iG197, iG240 or iG257 cells following the 0× or 2× treatment. (G) Similar experiments showing the levels of the invasion proteins MMP2 and MMP9 in proteins extracted from iGem9, iG197, iG240 or iG257 cells following the 0× or 2× treatment. (H) The size of orthotopic tumors developed in Nu/Nu mice injected with 2 × 10⁶ iG240 (T1-T5) or 2 × 10⁶ iG257 (T6-T10) cells within 10 weeks set limit for the experiment. (I) The size of orthotopic tumors developed in Nu/Nu mice injected with 2 × 10⁶ iG240 + 3 × 10⁵ MSCs (T11–T15) or 2 × 10⁶ iG257 + 3 × 10⁵ MSCs (T16–T20) cells within 10 weeks set limit for the experiment. In all parts of the figure experiments were done between 2–3 separate times.

