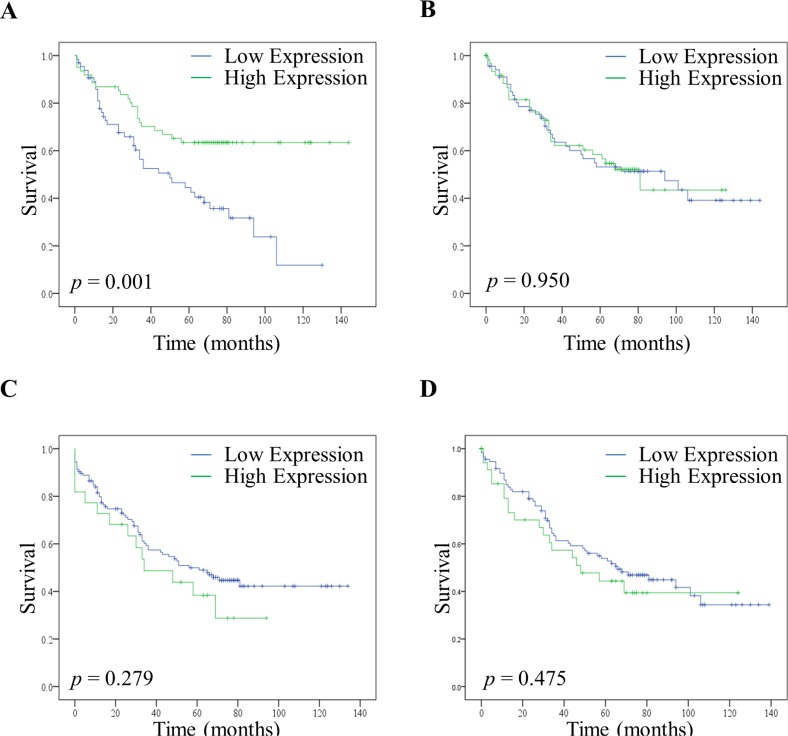
Figure 3. Disease free survival of patients with high and low expression of PKC Beta II.
High and low expression of PKC Beta II was determined using the median H score value for normal distant tissue and cancer tissue. (A) Effect of high (n = 61) and low (n = 65) expression of PKC Beta II on disease free survival in the normal distant epithelium tissue of CRC patients. (B) Effect of high (n = 75) and low (n = 77) expression of PKC Beta II on disease free survival in the normal distant stromal tissue of CRC patients. (C) Effect of high (n = 22) and low (n = 126) expression of PKC Beta II on disease free survival in the cancer epithelium tissue of CRC patients. (D) Effect of high (n = 40) and low (n = 126) expression of PKC Beta II on disease free survival in the cancer stromal tissue of CRC patients. P-values represent the Log-rank test.

