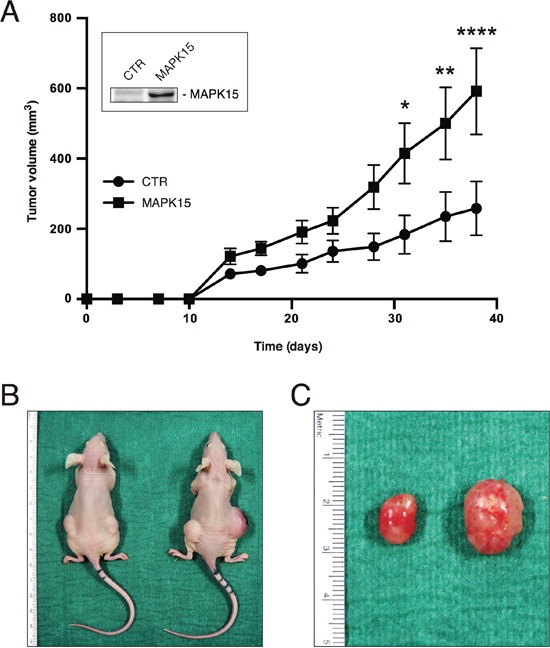
Figure 3. MAPK15 affects the tumorigenicity of human GCT-derived cell lines.

A. Growth curves of tumors generated by NTera2/D1 cells stably expressing MAKP15 or a control vector (pCEFL, CTR), after injection on the flank of athymic nude-Foxn1nu mice. Each point represents the mean volume ± SEM of ten tumors. The experiment was performed in triplicate. Inset shows MAPK15 protein levels in the two stable cell lines before injection, determined using a MAPK15-specific antibody. B. Representative mice bearing NTera2/D1 pCEFL- (left mouse) or NTera2/D1 MAPK15-derived tumors (right mouse). C. Representative tumor specimen excised from a control xenograft (left) in comparison to its MAPK15-positive counterpart (right). Significance (p value) was assessed by Student's t test, comparing the CTR and MAPK15-overexpressing conditions for each time-point. Asterisks were attributed as follows: *p< 0.05, **p<0.01, ****p<0.0001.
