
Figure 1.
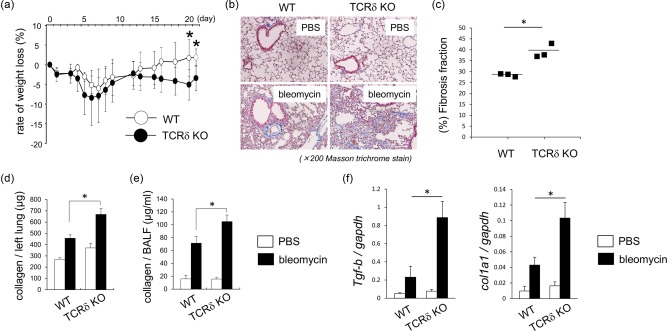
Histological and biochemical analyses of wild‐type (WT) and T cell receptor (TCR)δ–/– mice exposed to bleomycin. (a) Change in body weight after bleomycin exposure in WT (n = 4) and TCRδ–/– mice (n = 7). Data are representative of at least two independent experiments. Data are mean ± standard deviation (s.d.). *P < 0·05. (b) Lung tissues were obtained from WT (n = 3) and TCRδ–/– mice (n = 4) on day 21 after phosphate‐buffered saline (PBS) or bleomycin exposure. Paraffin sections were stained with Masson's trichrome. Original magnification ×200. (c) Fibrosis fraction in WT (n = 3) and TCRδ–/– (n = 3) mice was measured on 21 days after bleomycin exposure by quantitative image analysis. Data are representative of at least three independent experiments. Data are mean ± s.d. *P < 0·05. (d,e) The lung tissues and bronchoalveolar lavage fluid (BALF) were obtained from WT (n = 4) and TCRδ–/– mice (n = 7) on day 21 after bleomycin exposure and collagen production was determined. Data are representative of at least three independent experiments. Data are mean ± s.d. *P < 0·05. (f) Lung tissues were harvested from WT (n = 4) and TCRδ–/– mice (n = 7) on day 21 after bleomycin exposure. Lung mRNA was extracted and the expression of transforming growth factor (TGF)‐β and col1a1 mRNA was analysed by reverse transcription–polymerase chain reaction (RT–PCR). Data are representative of at least two independent experiments. Data are mean ± s.d. *P < 0·05.