
Figure 3.
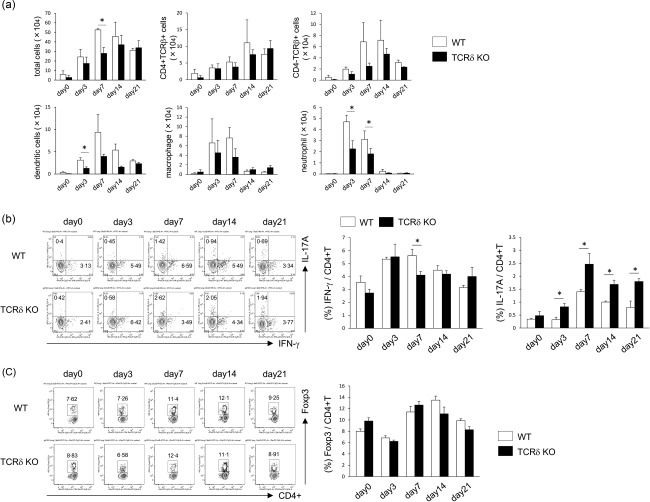
Inflammatory and cellular changes in lung tissues of mice exposed to bleomycin. (a) wild‐type (WT) (n = 3) and T cell receptor (TCR)δ–/– mice (n = 4) were infused intratracheally with bleomycin. At days 0, 3, 7, 14 and 21, the number of total, CD4+TCRβ+, CD4–TCRβ+, dendritic cells (CD11c+), macrophages (CD11c–CD11b+Gr‐1–) and neutrophils (CD11c–CD11b+Gr‐1+) was analysed by flow cytometry (FCM). Data are representative of at least two independent experiments. Data are mean ± standard deviation (s.d.). *P < 0·05. (b) Pulmonary lymphocytes were harvested from WT (n = 3) and TCRδ–/– mice (n = 4) on days 0, 3, 7, 14 and 21 after bleomycin exposure and stimulated by phorbol myristate acetate (PMA)/ionomycin for 6 h. Cells were stained for TCRβ, CD4, interferon (IFN)‐γ, interleukin (IL)−17A and analysed by flow cytometry. CD4+TCRβ+ cells were gated. Data are representative of at least three independent experiments. Data are mean ± s.d. *P < 0·05. (c) Pulmonary lymphocytes were harvested from WT (n = 3) and TCRδ–/– mice (n = 4) on days 0, 3, 7, 14 and 21 after bleomycin exposure. Cells were stained for TCRβ, CD4, forkhead box protein 3 (FoxP3) and analysed by flow cytometry. CD4+TCRβ+ cells were gated. Data are representative of at least two independent experiments. Data are mean ± s.d. *P < 0·05.