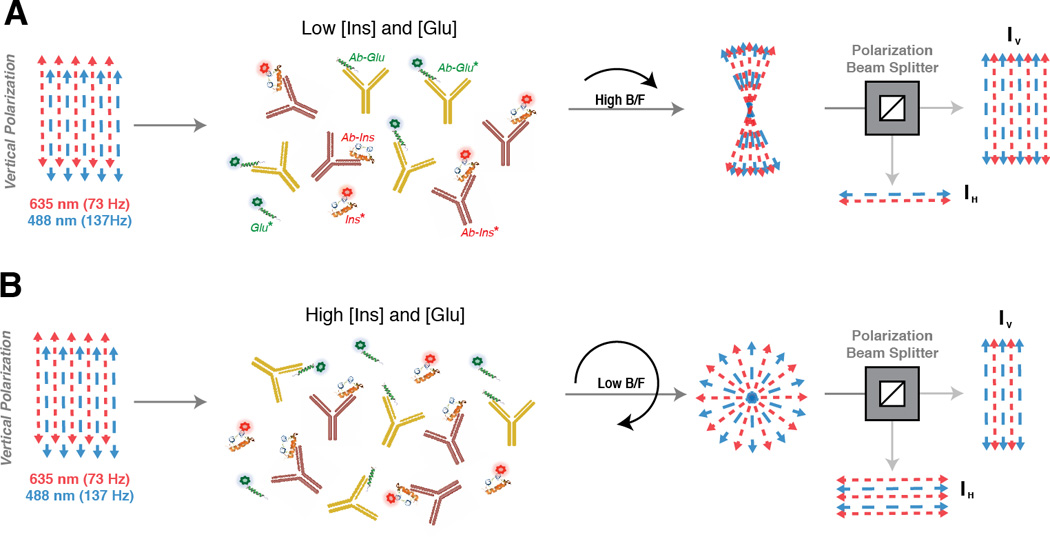
Figure 1. Frequency-encoded fluorescence anisotropy simultaneous immunoassays.

The excitation light is vertically polarized prior to sample excitation and separate channels encoded at different frequencies (red = 73 Hz, blue = 137 Hz), illustrated by different dashed lines. Following emission from the bulk solution, the vertical and horizontal polarizations are split and detected by two PMTs. An illustration of the results expected for low [insulin] and [glucagon] is shown in (A) and high [insulin] and [glucagon] is shown in (B). The extent of depolarization of the bulk emission light is determined by the rotational diffusion of the fluorescent probe, which is dependent on the size of the fluorescent probe. A high B/F occurs in (A) and a low B/F in (B) resulting in different extents of depolarization of the emission light, yielding distinct rtot values upon analysis.
