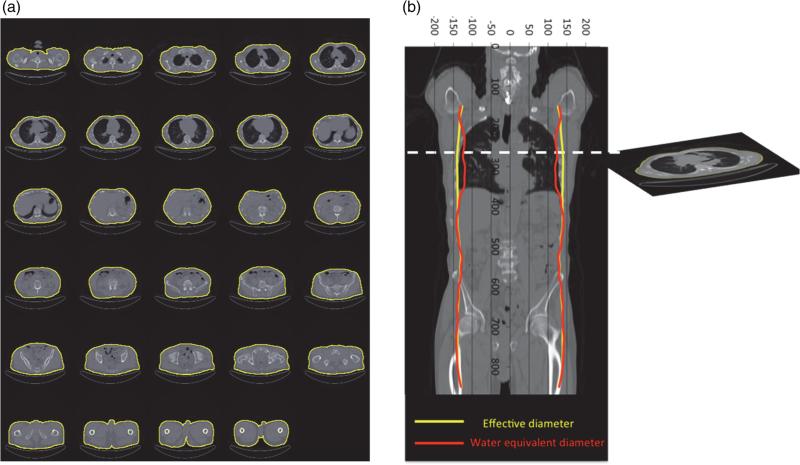
Figure 2.
Comparison of effective diameter and Dw for a patient data set. A threshold of −383 HU was used to remove the patient table for every 10th image in the data set. The segmented ROIs are shown in (a). The area and mean CT number of the ROI in each axial image were used to calculate effective diameter and Dw,, which are superimposed on a coronal reformation of the patient data in (b). This visually demonstrates that the use of effective diameter will overestimate Dw in the thorax.

