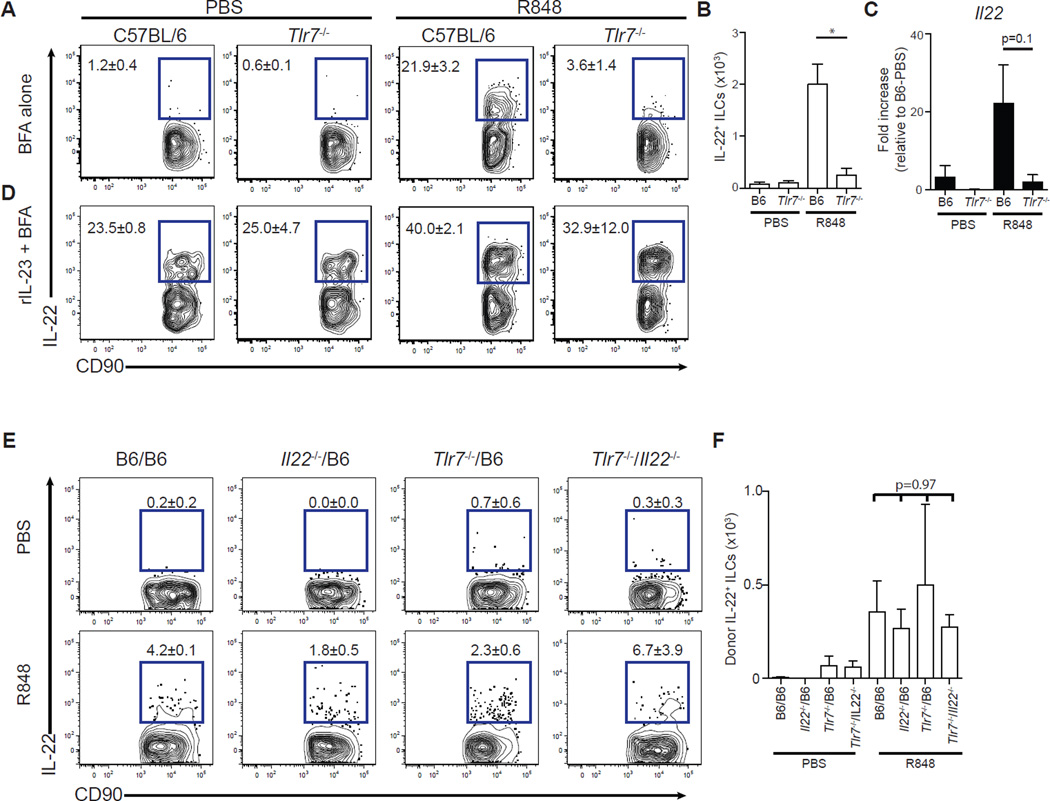
Fig. 4. R848 signals through TLR-7 but does not directly act on ILCs to drive IL-22 production.
Mice were treated with ampicillin for 3 days and administered PBS or R848 (50 µg) daily orally. (A and B) Single-cell suspensions isolated from the mLNs of C57BL/6 or Tlr7−/− mice 3 hours after final PBS or R848 treatment were incubated in medium in the presence of BFA for 3 hours and assessed for IL-22 production. Frequency (A) and number (B) of IL-22+ ILCs. FACS plots gated on live, CD45+, non-T non-B, CD11bneg, NK1.1neg CD90+ cells (*P ≤ 0.05, Mann-Whitney test; n = 3). (C) Il22 gene expression in the ileum of C57BL/6 or Tlr7−/− mice as quantified by qRT-PCR, normalized to Hprt, and displayed as fold increase over PBS-treated C57BL/6 mice (P = 0.1, Mann-Whitney test; n = 3). (D) Single-cell suspensions isolated from the mLNs of C57BL/6 or Tlr7−/− mice 3 hours after final PBS or R848 treatment were incubated in medium supplemented with recombinant IL-23 (rIL-23; 40 ng/ml) in the presence of BFA for 3 hours and assessed for IL-22 production. (E and F) Cells isolated from the mLNs of C57BL/6, Tlr7−/−/B6, Il22−/−/B6, and Tlr7−/−/Il22−/− mixed BMC mice 3 hours after final PBS or R848 treatment were incubated in medium in the presence of BFA for 3 hours and assessed for IL-22 production. Frequency (E) and number (F) of IL-22+ ILCs. FACS plots gated on donor-derived, live, CD45+, non-T non-B, Gr-1neg NK1.1neg CD90+ cells [n = 3; multiple-comparison two-way analysis of variance (ANOVA) test]. Data are means ± SEM.

