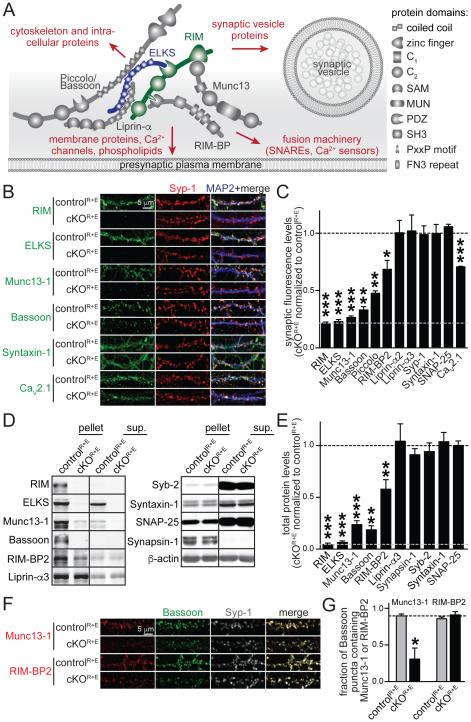
Figure 1. Genetic removal of RIM and ELKS leads to disruption of the active zone.
A. Schematic of the protein complex at the active zone and its connections to other important presynaptic protein families (marked in red). SAM: sterile alpha motif, MUN: Munc13 homology domain, PDZ: PSD-95/Dlg1/ZO-1 homology domain, SH3: Src homology 3 domain, PxxP: proline rich motif, FN3: fibronectin 3 repeat.
B, C. Sample images (B) and quantitation (C) of protein levels at RIM and ELKS knockout (cKOR+E) and control (controlR+E) synapses using confocal microscopy. The synaptic vesicle marker Synaptophysin-1 (Syp-1) was used to define the region of interest (ROI). The black dotted line indicates control levels and the grey dotted line non- specific staining as assessed for RIM. Example images for RIM-BP2, Piccolo, Liprin-α2, Liprin-α3, SNAP-25, and quantitation of puncta number and size are in Fig. S1 (controlR+E n = 3 independent cultures, cKOR+E n = 3, 10 images per culture).
D, E. Quantitative Western blotting for presynaptic proteins using fluorescent secondary antibodies. Some cultures were fractionated into pellet and supernatant (sup.) using Triton X-100 solubilization and ultracentrifugation. Quantitation (E) of total protein levels in cKOR+E neurons normalized to protein levels in controlR+E neurons are shown. Black and grey dotted as in C. For detailed analysis of protein solubility and protein levels in each fraction see Table S1B (controlR+E n = 6 independent cultures, cKOR+E n = 6, except for Bassoon where n = 3 for both conditions, Syb-2: synaptobrevin/VAMP-2).
F, G. Sample images (F) and quantitation (G) of the fraction of Bassoon puncta containing Munc13-1 or RIM-BP2. The fraction of Bassoon pixels and the fraction of Syp-1 puncta containing Munc13-1 or RIM-BP2 are in Fig. S1 (controlR+E n = 6 independent cultures, cKOR+E n = 6, 10 images per culture).
All data are means ± SEM; *p ≤ 0.05, **p ≤ 0.01, ***p ≤ 0.001 as determined by Student's t test. All numerical data are in Table S1.

